Analysis of
Feline Surrenders
As the feline behavior and enrichment coordinator for an animal shelter, I have a vested interest in why cats are coming into shelters, as well as in how how effective our behavior consulting services are. I was also curious as to how often they were being utilized, and other ways we may be able to help our community to prevent surrenders outside of behavioral assistance. I started this project before I knew what "Data Analysis" was, but soon learned, and revisted it to do it in a more "proper" manner. This project only utilized Excel and Tableau, but was no less challenging than the SQL or Rstudio projects I've explored within my certificate programs.
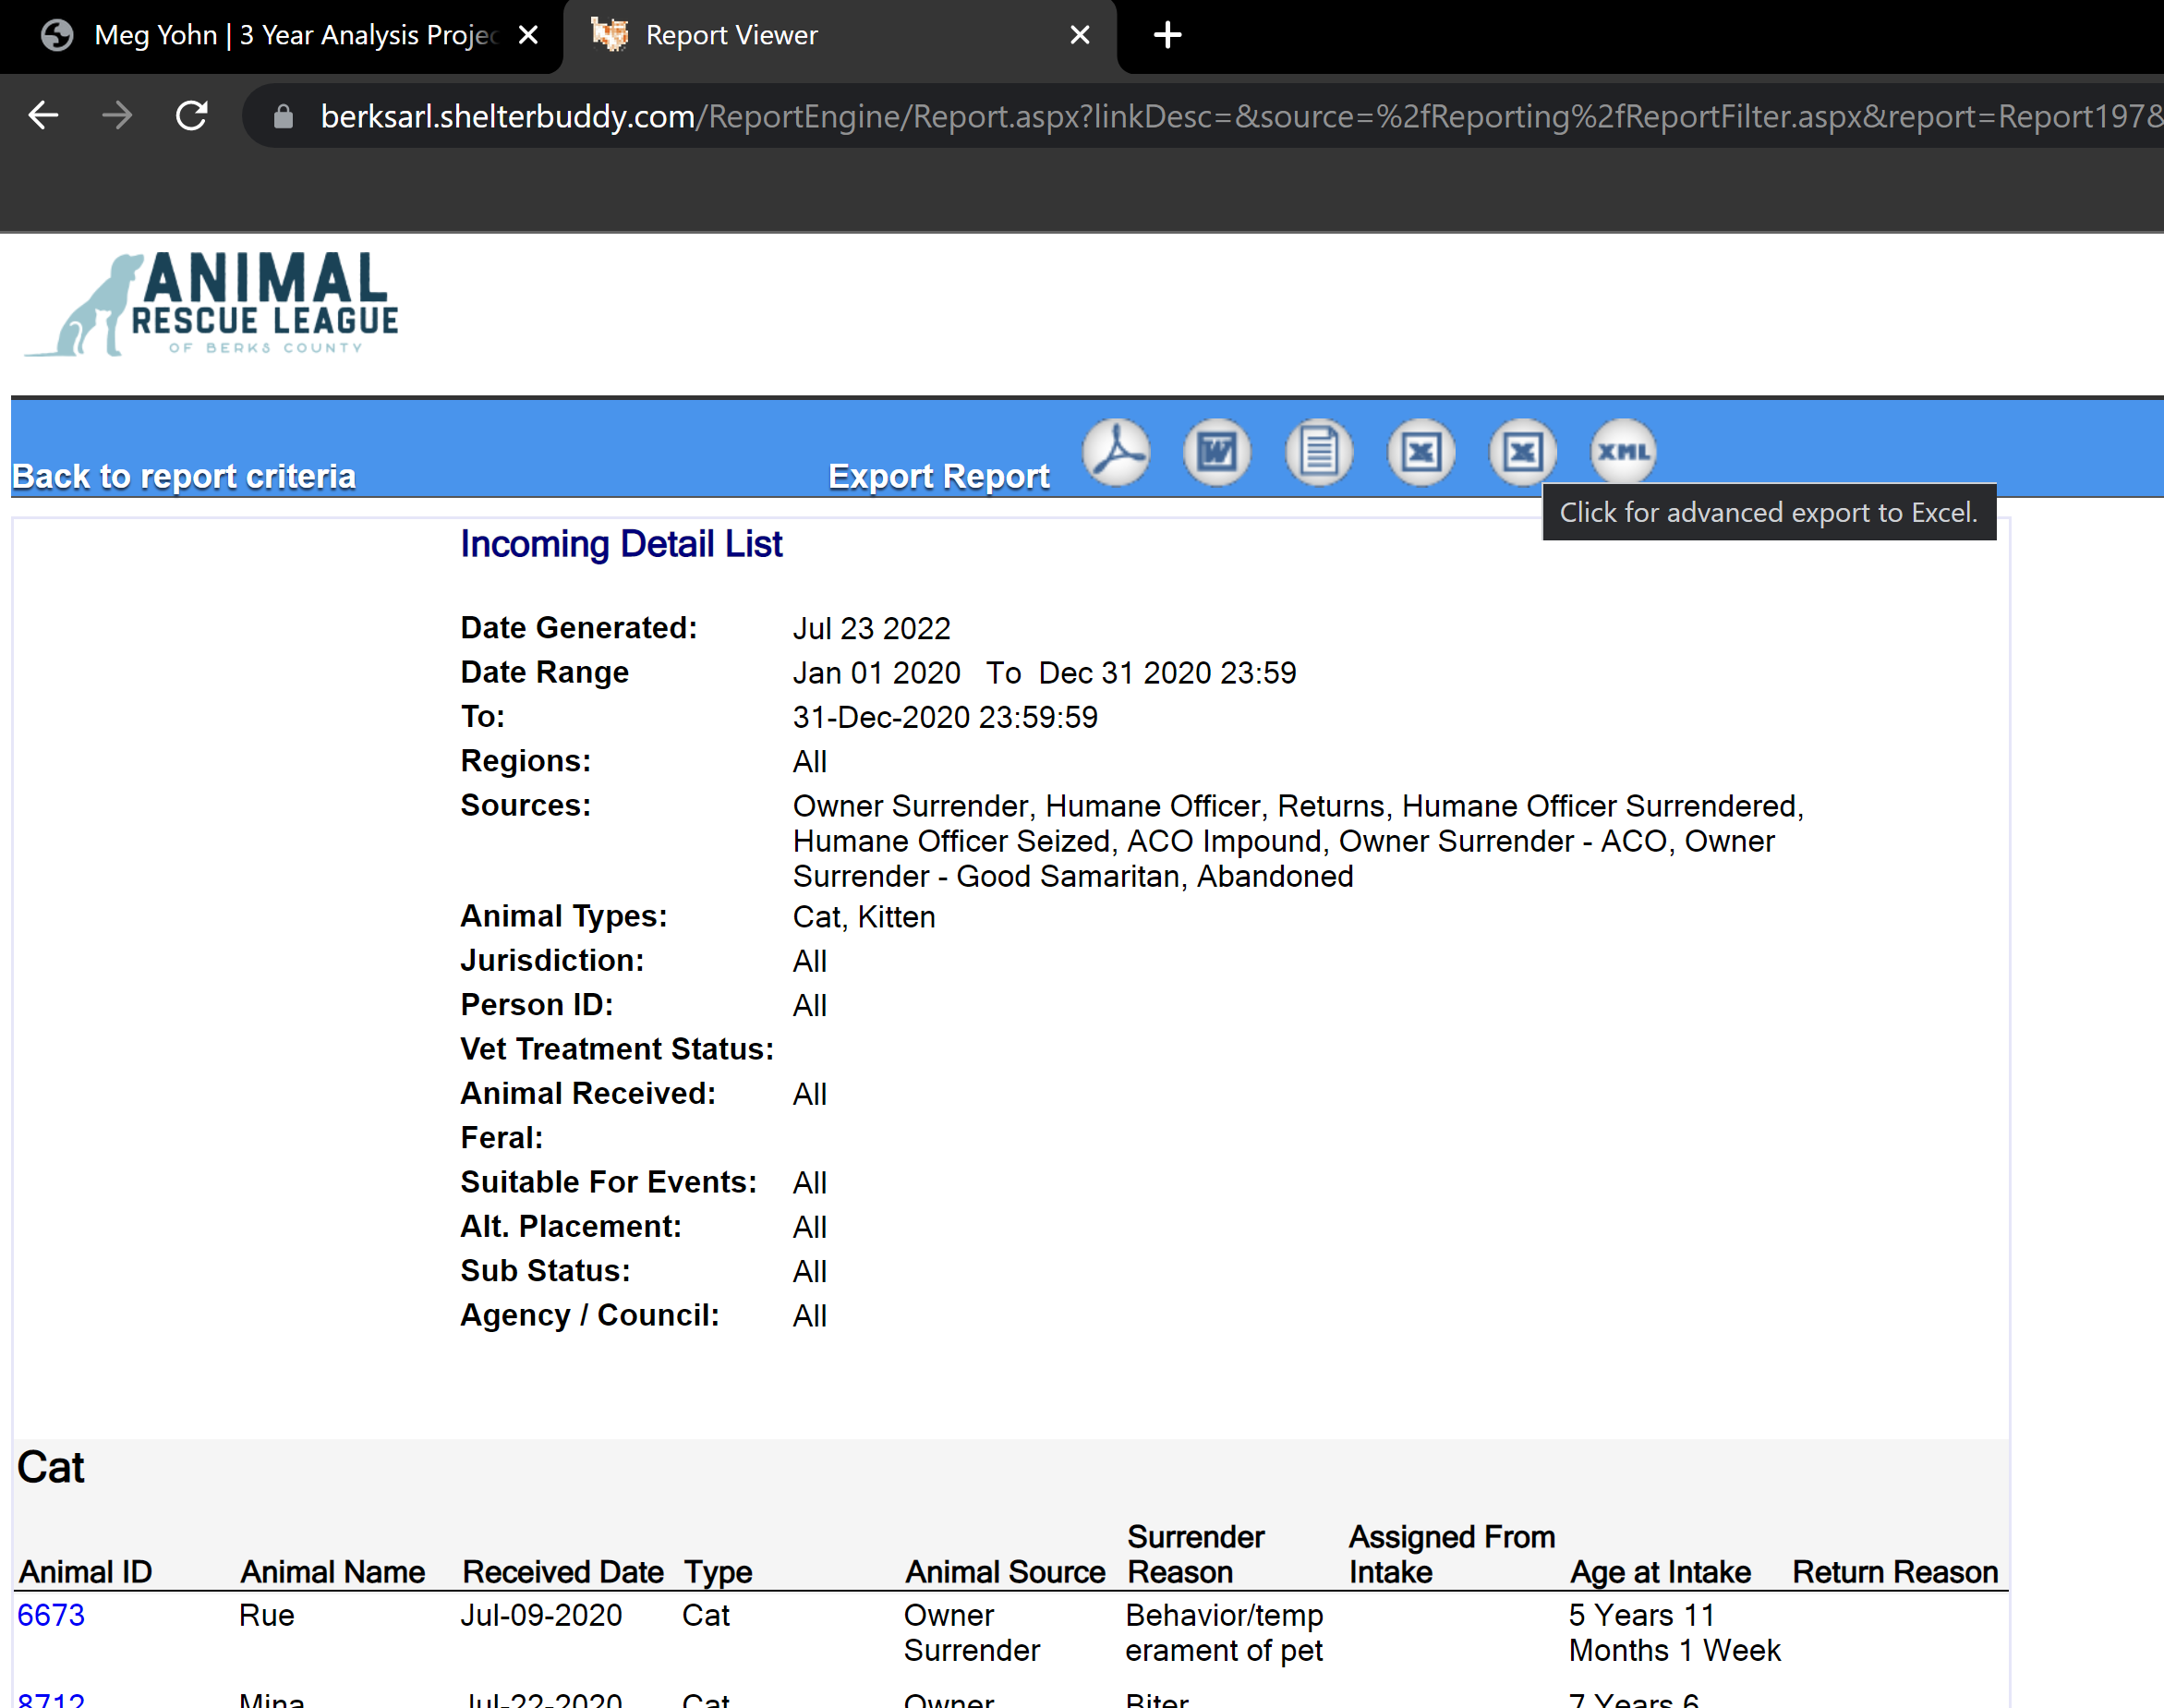
I decided to cross-reference the past three years against each other to gain insight to common trends or changes. Our shelter uses a database called Shelter Buddy to store our animal charts and daily information - this program is nice as it enables us to run a lot of valuable reports, however the formatting is not exactly ideal for this purpose.
I began by exporting separate reports for 2020, 2021, and the first 6 months of 2022. From there, I began reformatting the sheet to make it cleaner - removing "decorative" labels, formatting numbers as numbers, as in the export they always experienced errors, changed the dates to my preferred format, creating the surrender categories I preferred to use. I then added the additional columns I felt might be necessary (such as surrender detail), and removed unnecessary ones that were automatic with the report.
(This page is primarily for showing my process, however, for confidentiality purposes screenshots of my primary spreadsheet containing shelter-sourced data cannot be posted here. If requested for professional purposes, an altered version with confidential information removed that is agreed upon by the data source can be provided)
I then began going into each animal's file and double checking the data for accuracy. Why might a report not be accurate, you might be curious? There are a variety of reasons, some not necessarily the explicit fault of shelter staff. We have policies that state that an animal in care for (x) amount of time might incur a surrender fee - or those outside of contracted areas, where municipalities are not opting into our services but the public still needs our assistance - but sometimes that ends up with them entered as surrenders when they're not which requires a QC (quality check). Further, I noticed within this project that "Change of Lifestyle" is an easy in-house fallback for surrender reason, even if there's a category available for the actual surrender reason, hurting report accuracy. This is likely due to pressure and time constraints, but is very problematic for reporting purposes. I visited every single animal's file, removed all of those that didn't belong, and corrected all of those that were inaccurate. A few could not be confirmed or ruled out as surrenders - so I created a category "Poor Data Entry" instead of making them anomalies and removing them, as knowing data entry is an issue is valuable for the purpose of this report. 1,058 entries were removed from these three reports.
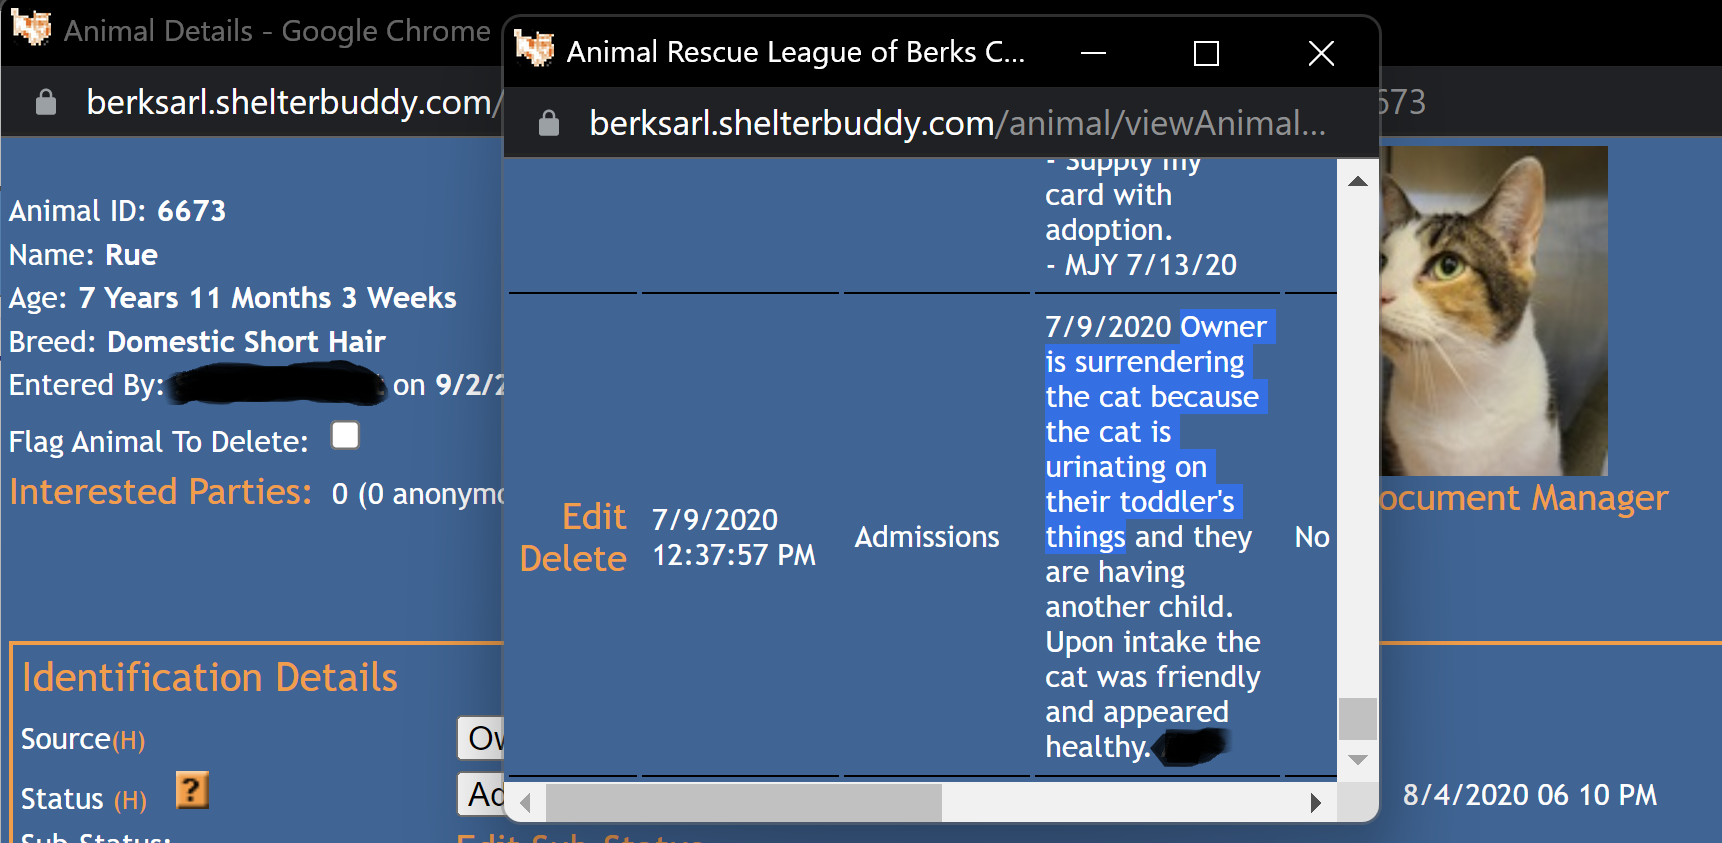
Animal was noted with reason "behavior of animal" - changed to LBA (Litter Box Avoidance) for better accuracy.
I repeated this for every animal in every consecutive year, then double checked to make sure everything was properly formatted and there were no duplicate entries, as in the export process there would often be errors resulting in duplicate and empty rows. From here, I went through my records to collect consult data and found whom I consulted and cross-referenced that with the information available in our database to see what correlated, and what consults were for outside animals that did not end up surrendered, or simply missed being recorded within our shelter database to make sure everything matched up.
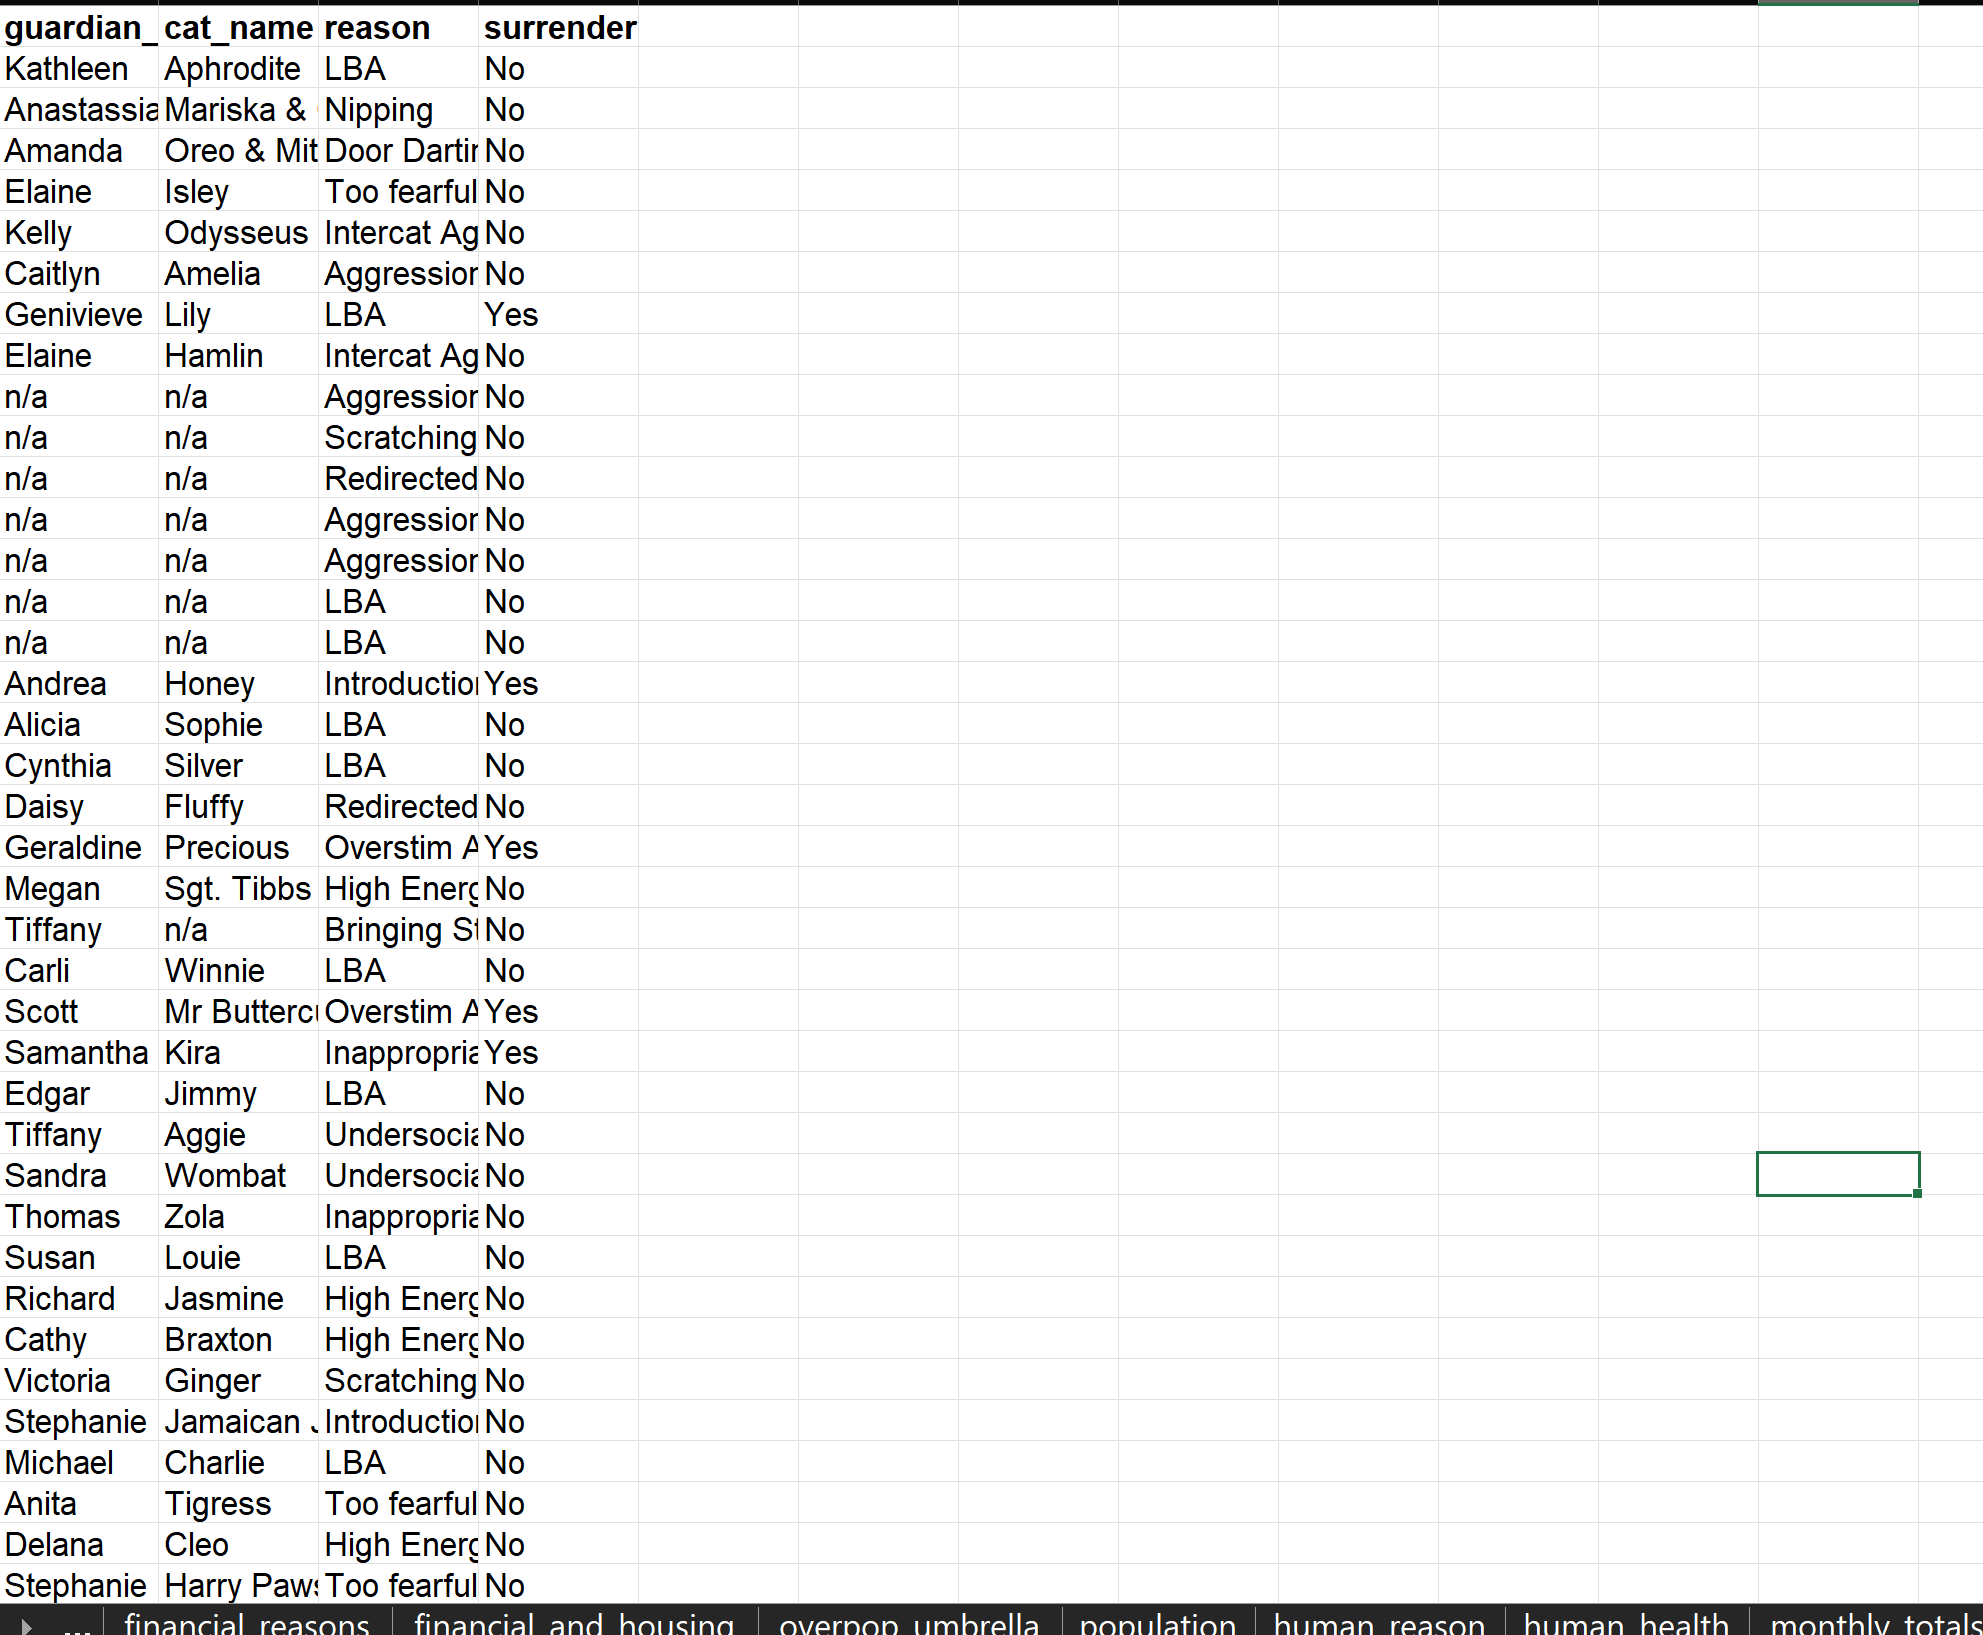 (2020)List of behavior consults, both for surrendered and non-surrendered animals.
From here, I separated data into workbooks in order to keep things organized - "Financial and Housing", "Behavior", "Veterinary", "Human Health", and so forth. I created pivot tables for each datachunk to make Tableau viz creation more streamlined.
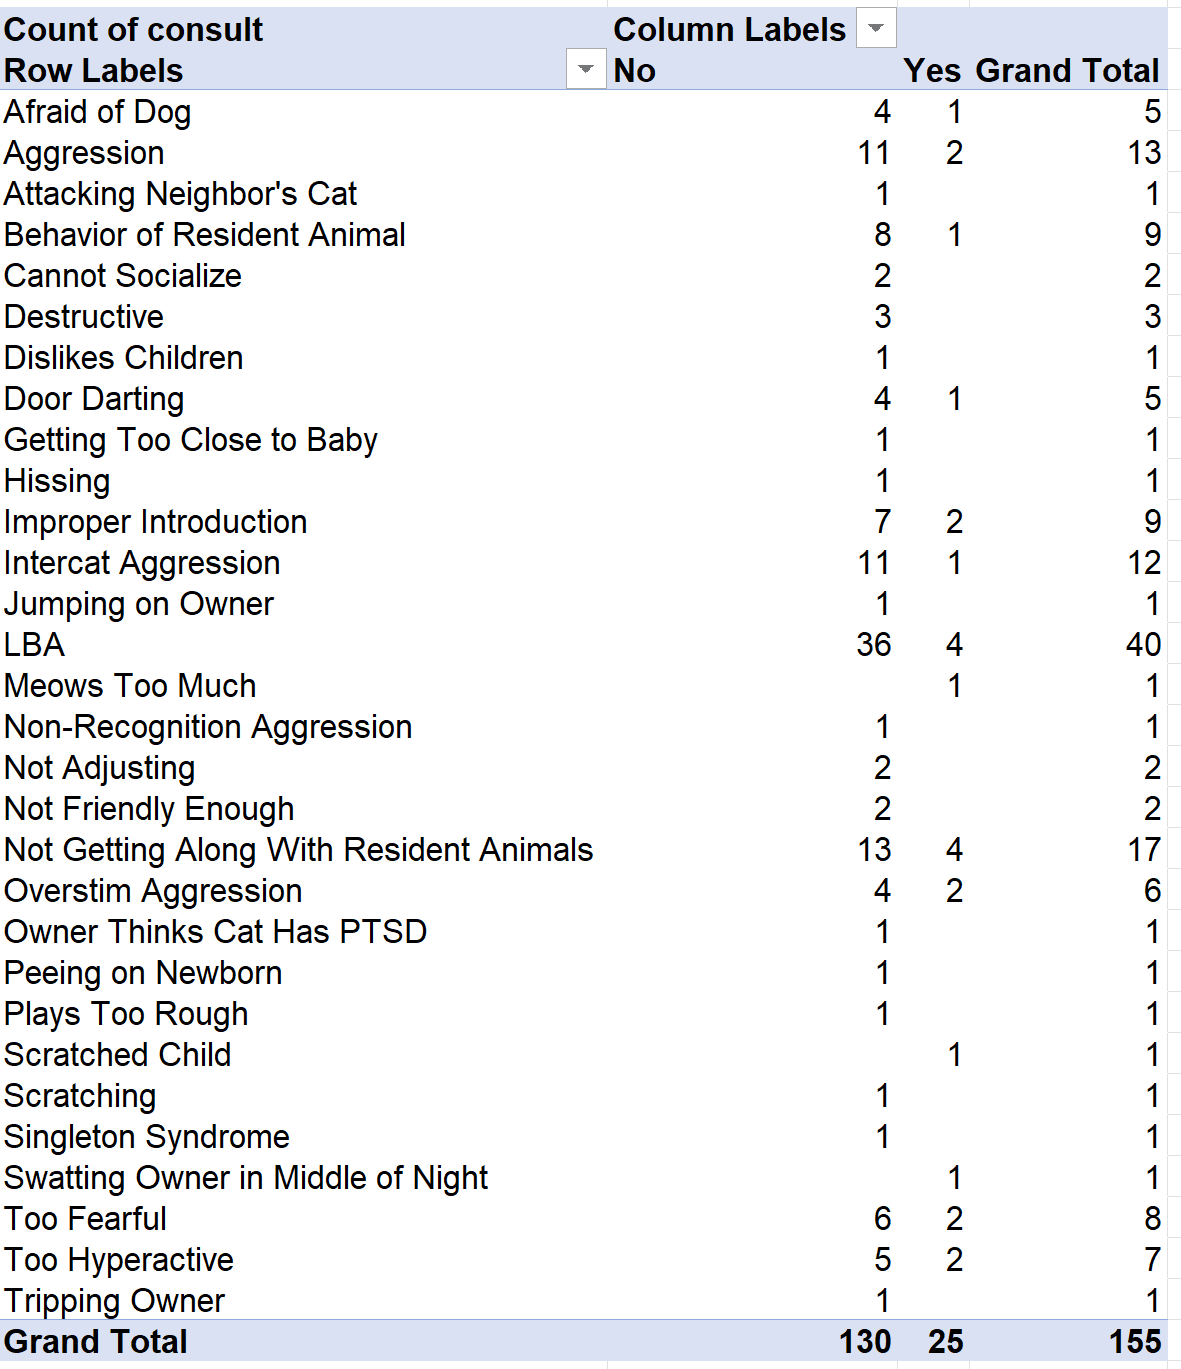 (2020) Example of Pivot Table for behavior surrenders.
I looked over the data available and compiled the valuable information I could take with me, making a few tables of that data in order to be able to make that into viz' - then moved forward to Tableau.
2020 Information
After completing the visualizations for the 3 spreadsheets of data, I created a fourth sheet for cross-referencing the years against each other and creating visualizations from that analysis, then returned to Tableau once more.
Now we will go over my findings and visualizations.
2020
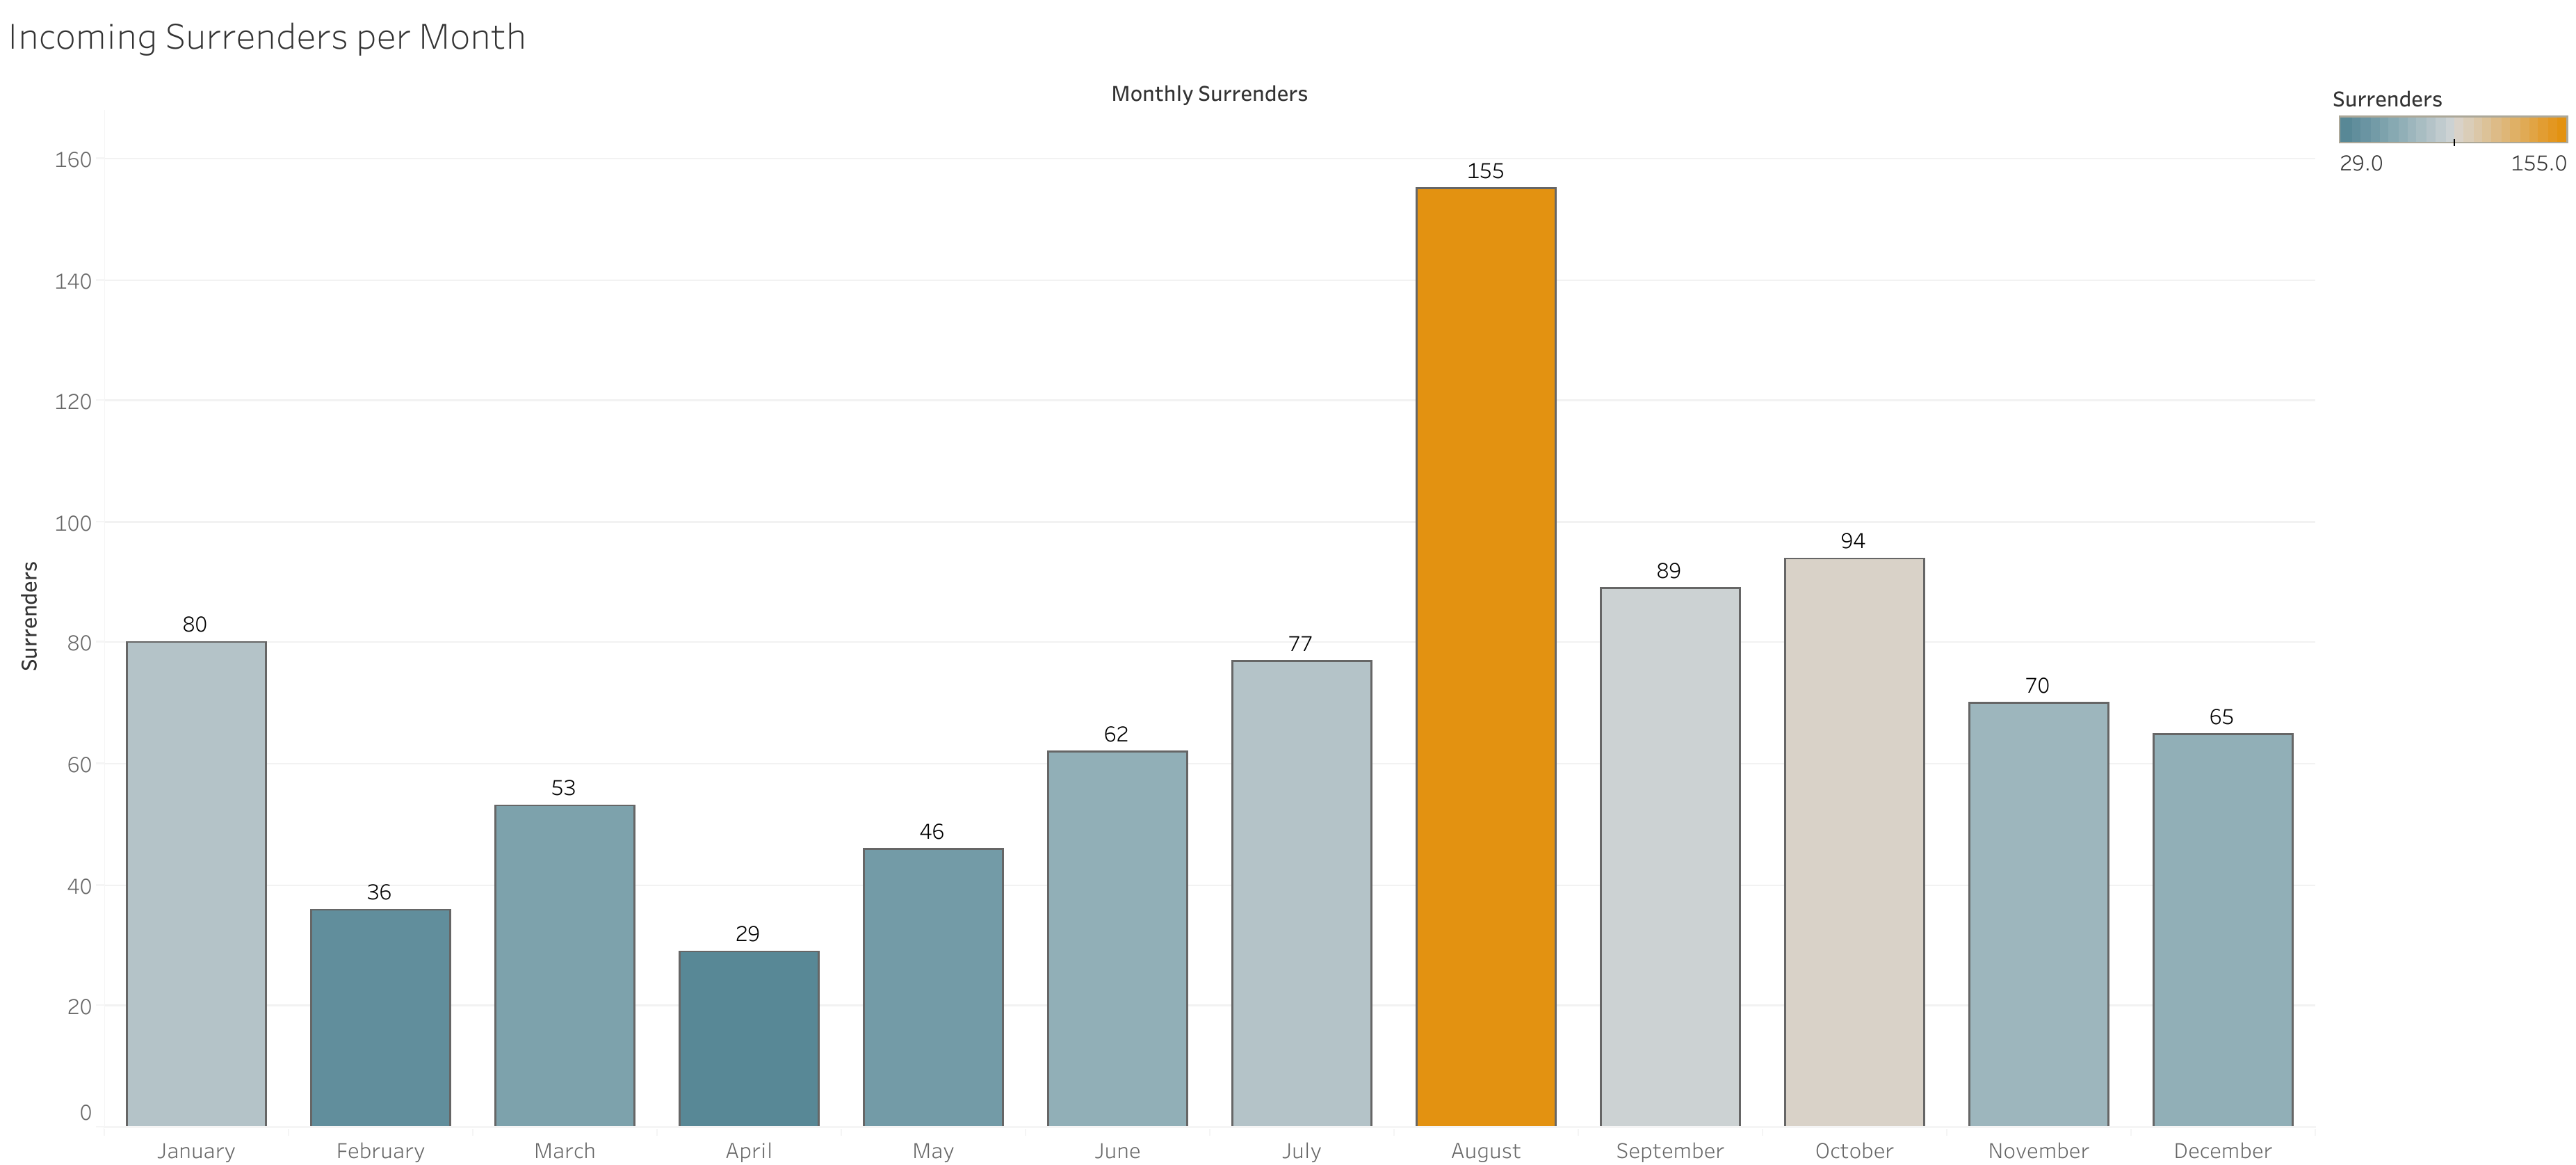
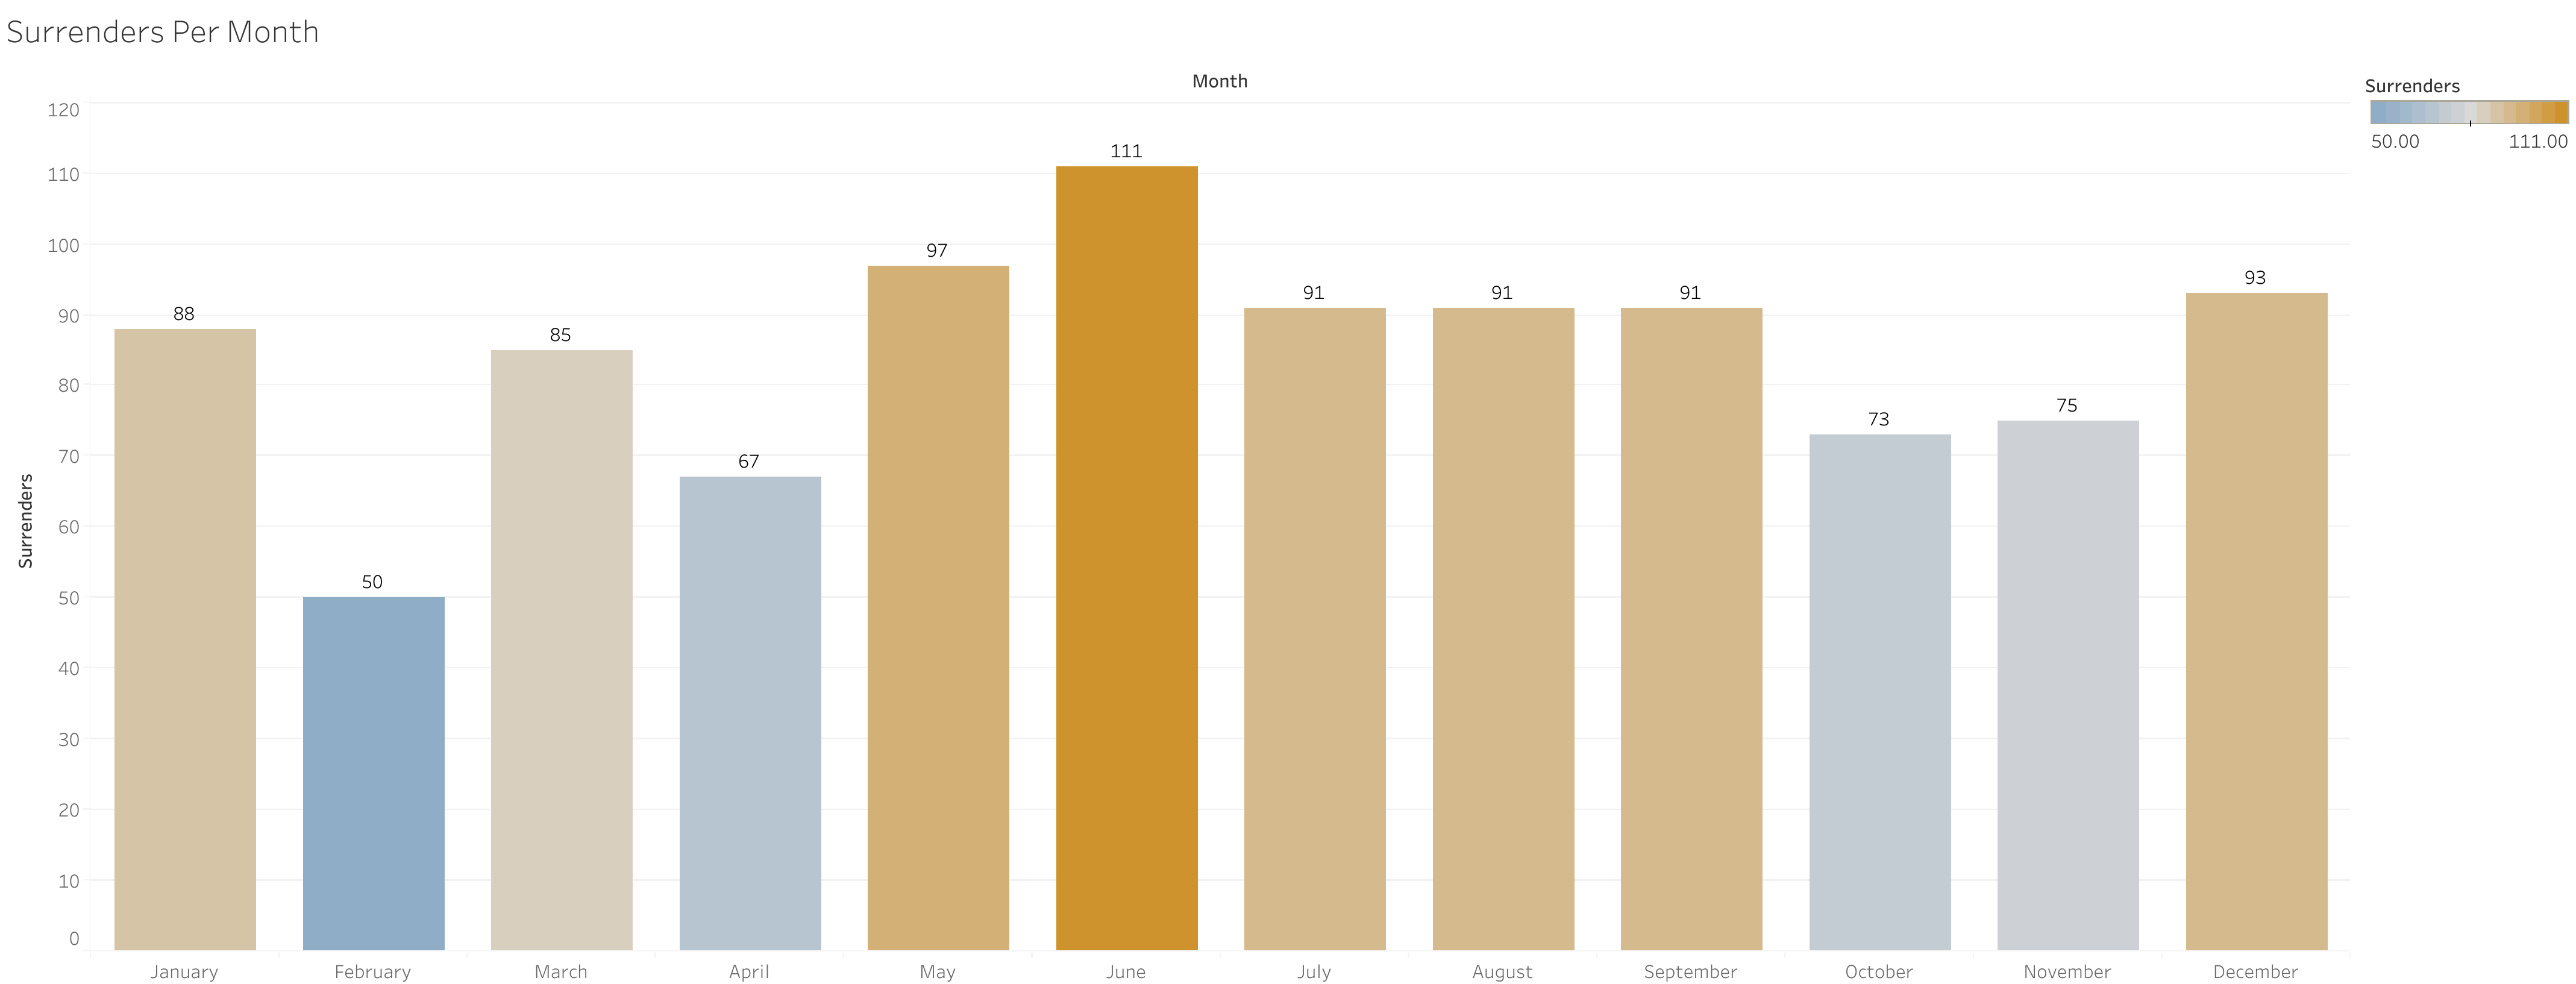
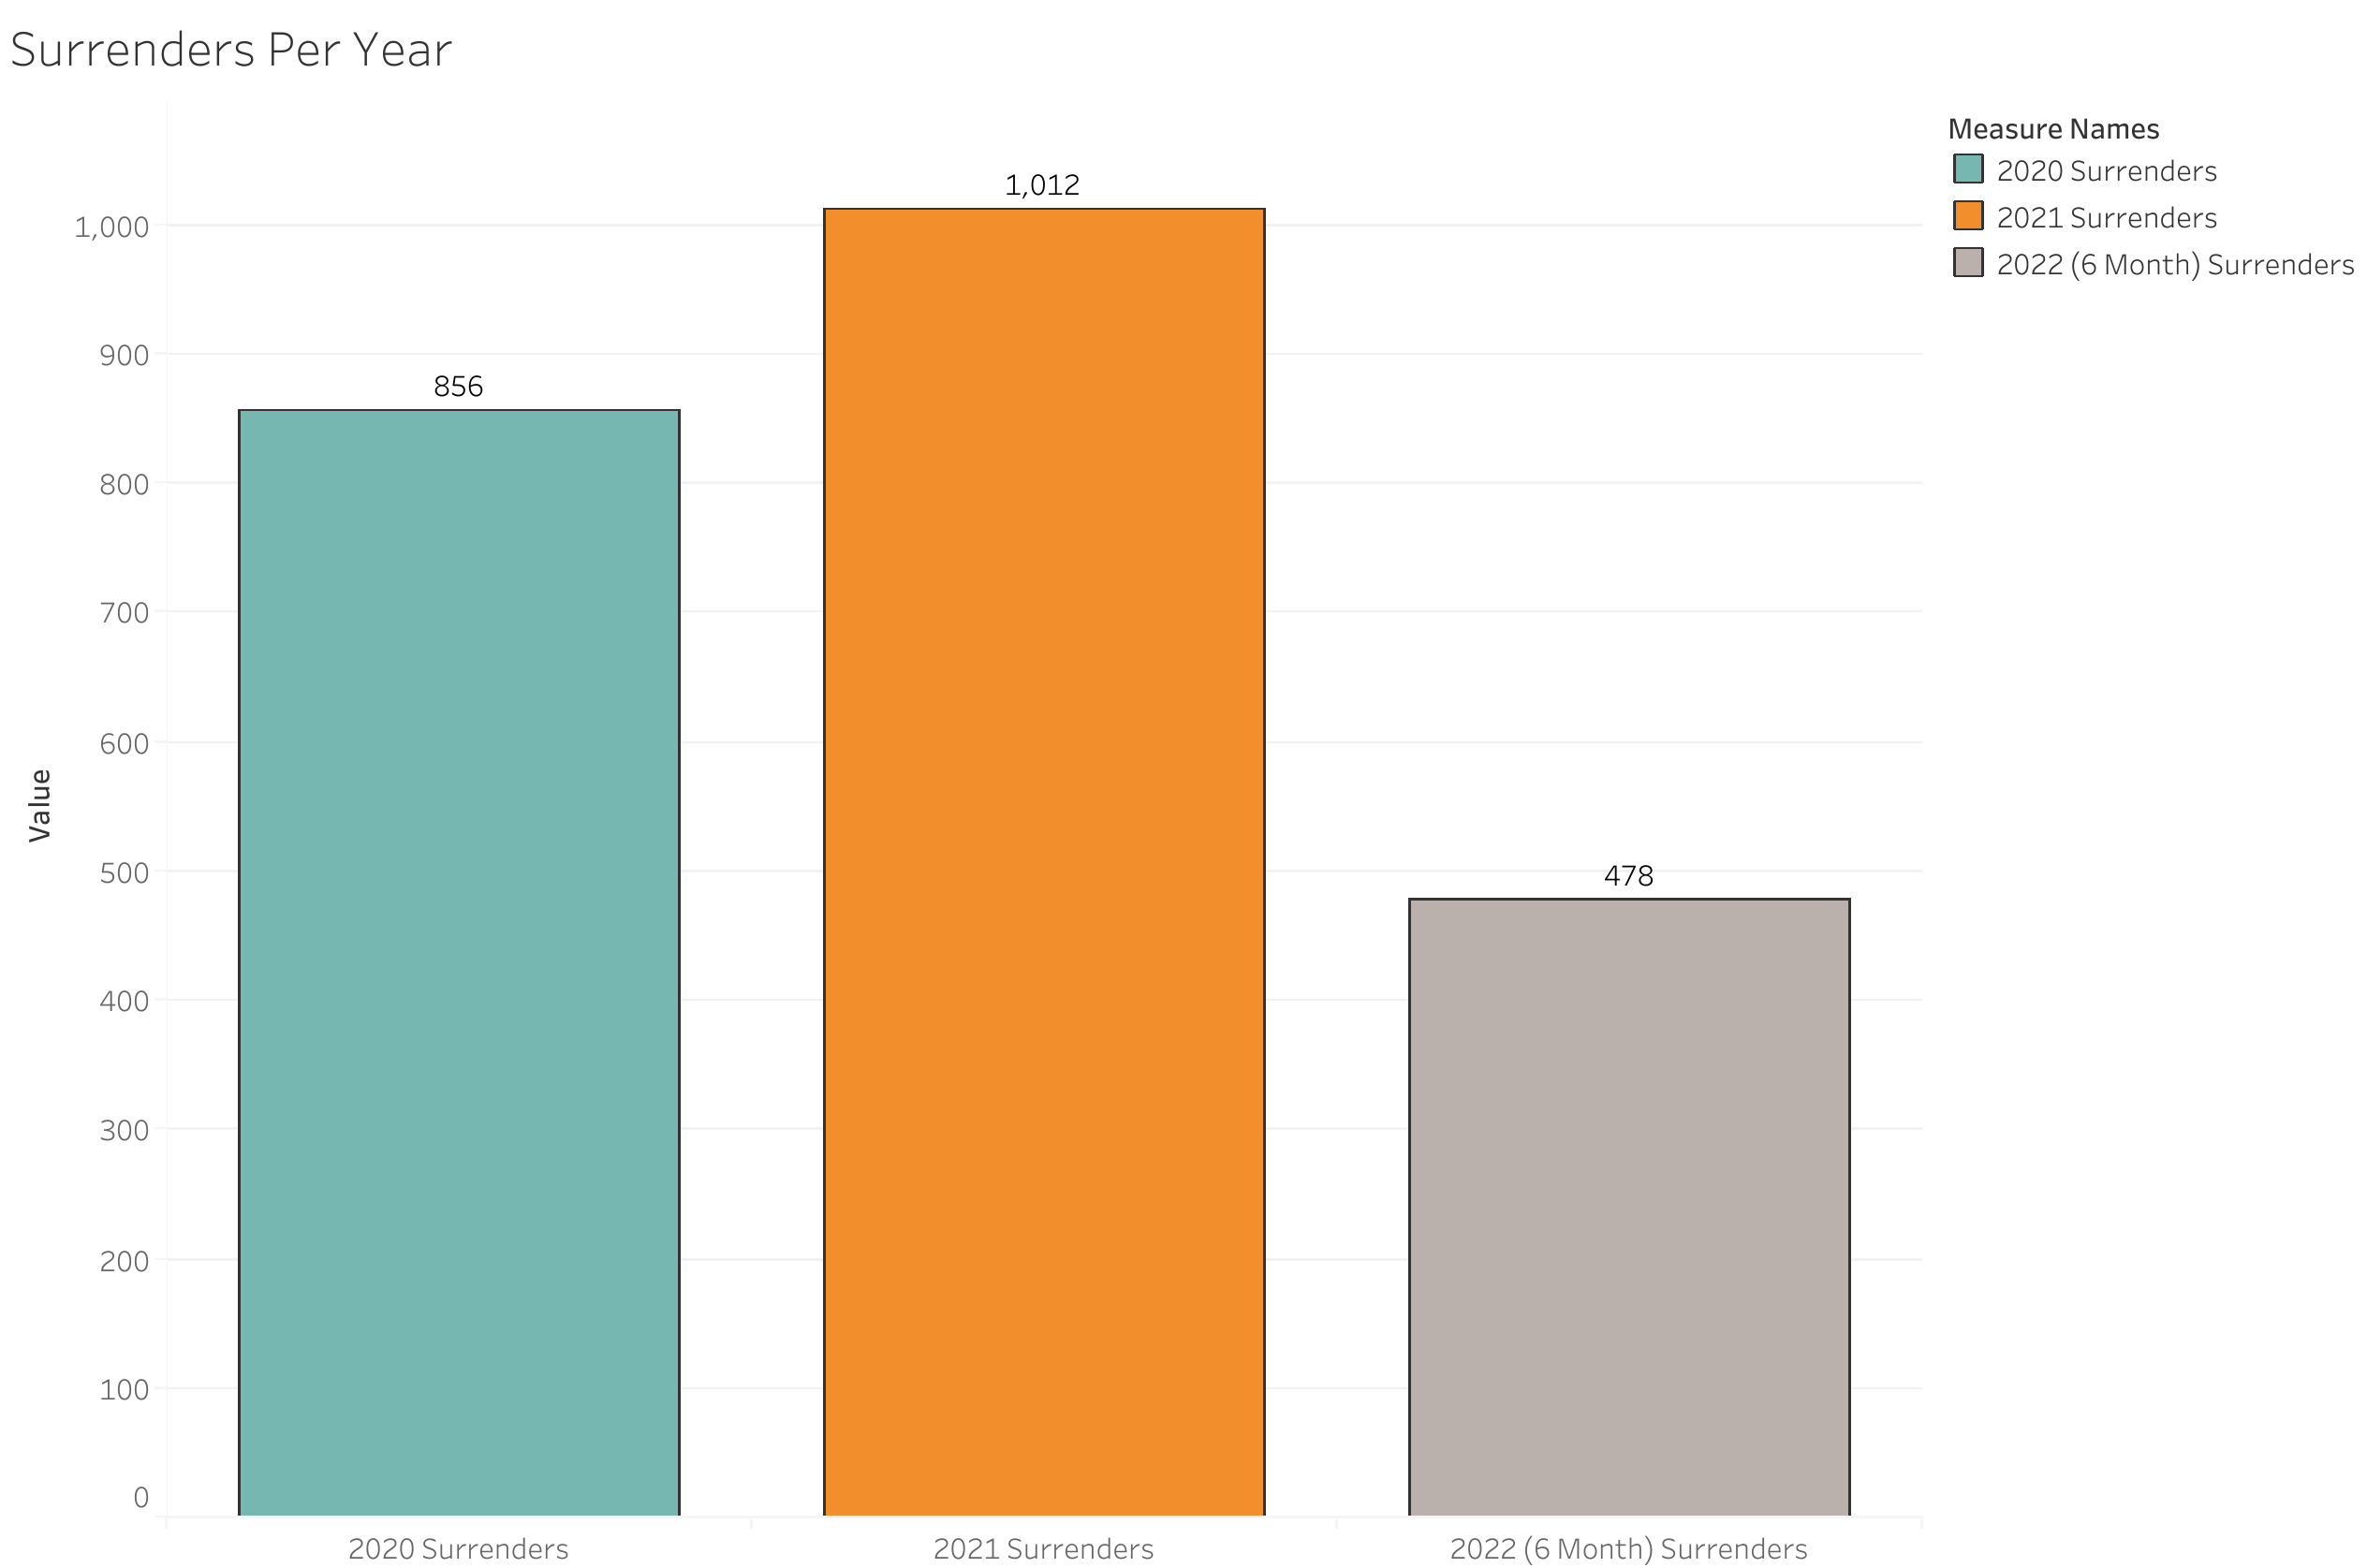
I decided to separate the 856 surrenders by month in order to see if there is a yearly trend in surrender spikes. It's a common conception around the internet and throughout animal welfare that shortly after the winter holidays there is a sharp increase - January did spike a bit higher than December, but I don't know that it's enough to make the correlation. August, by far, was the highest month for surrenders in 2020.
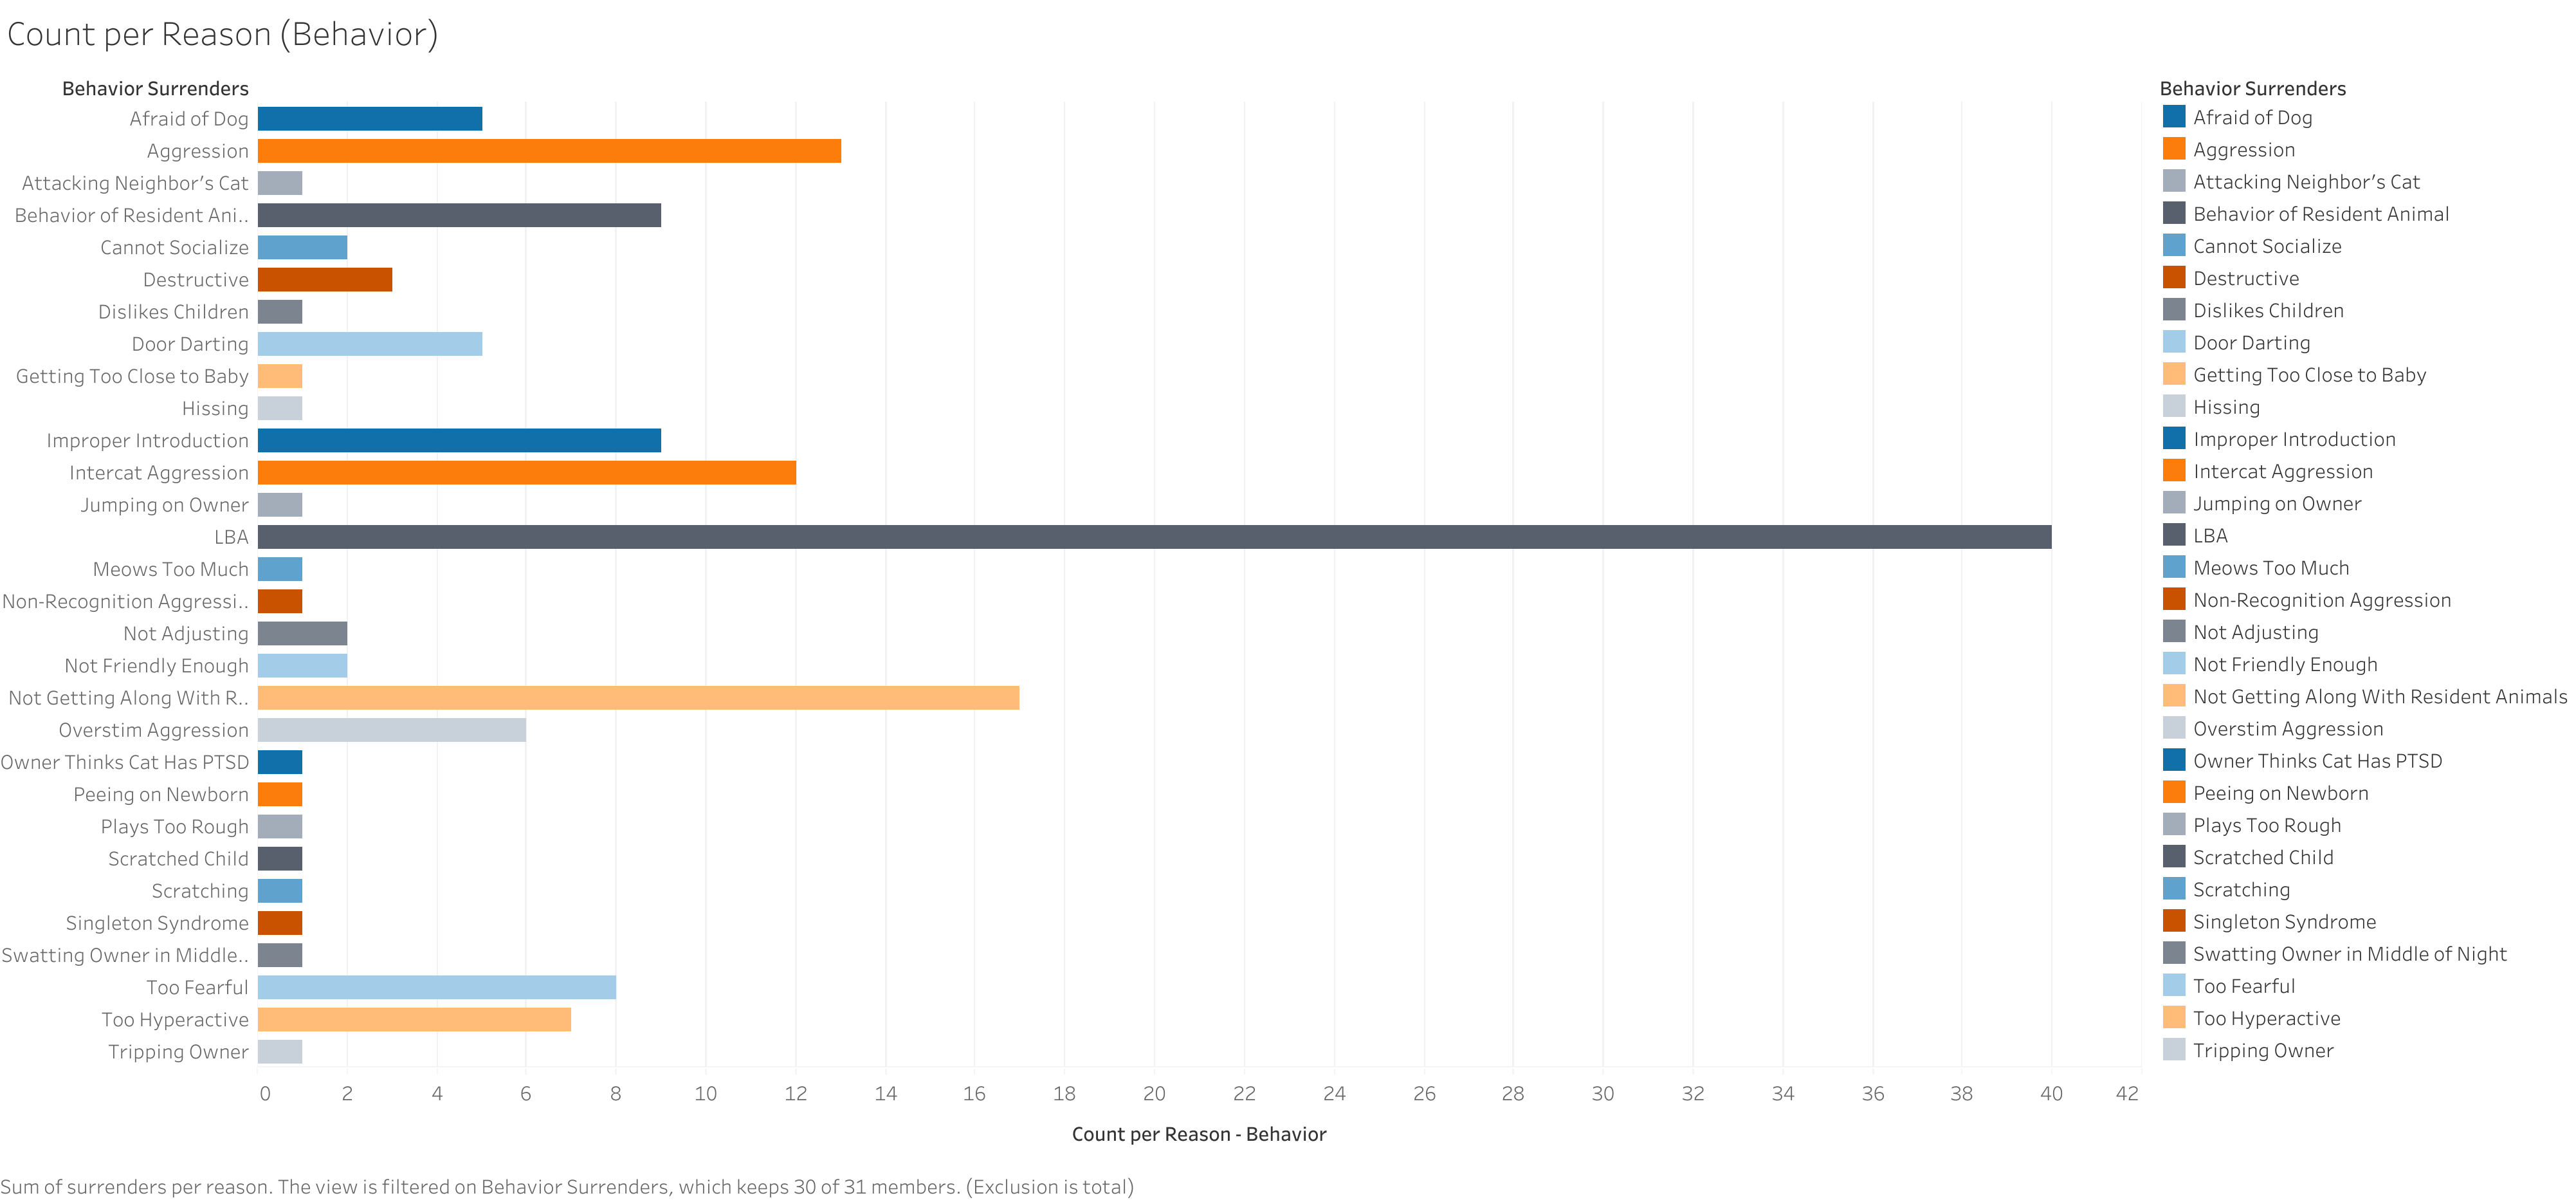
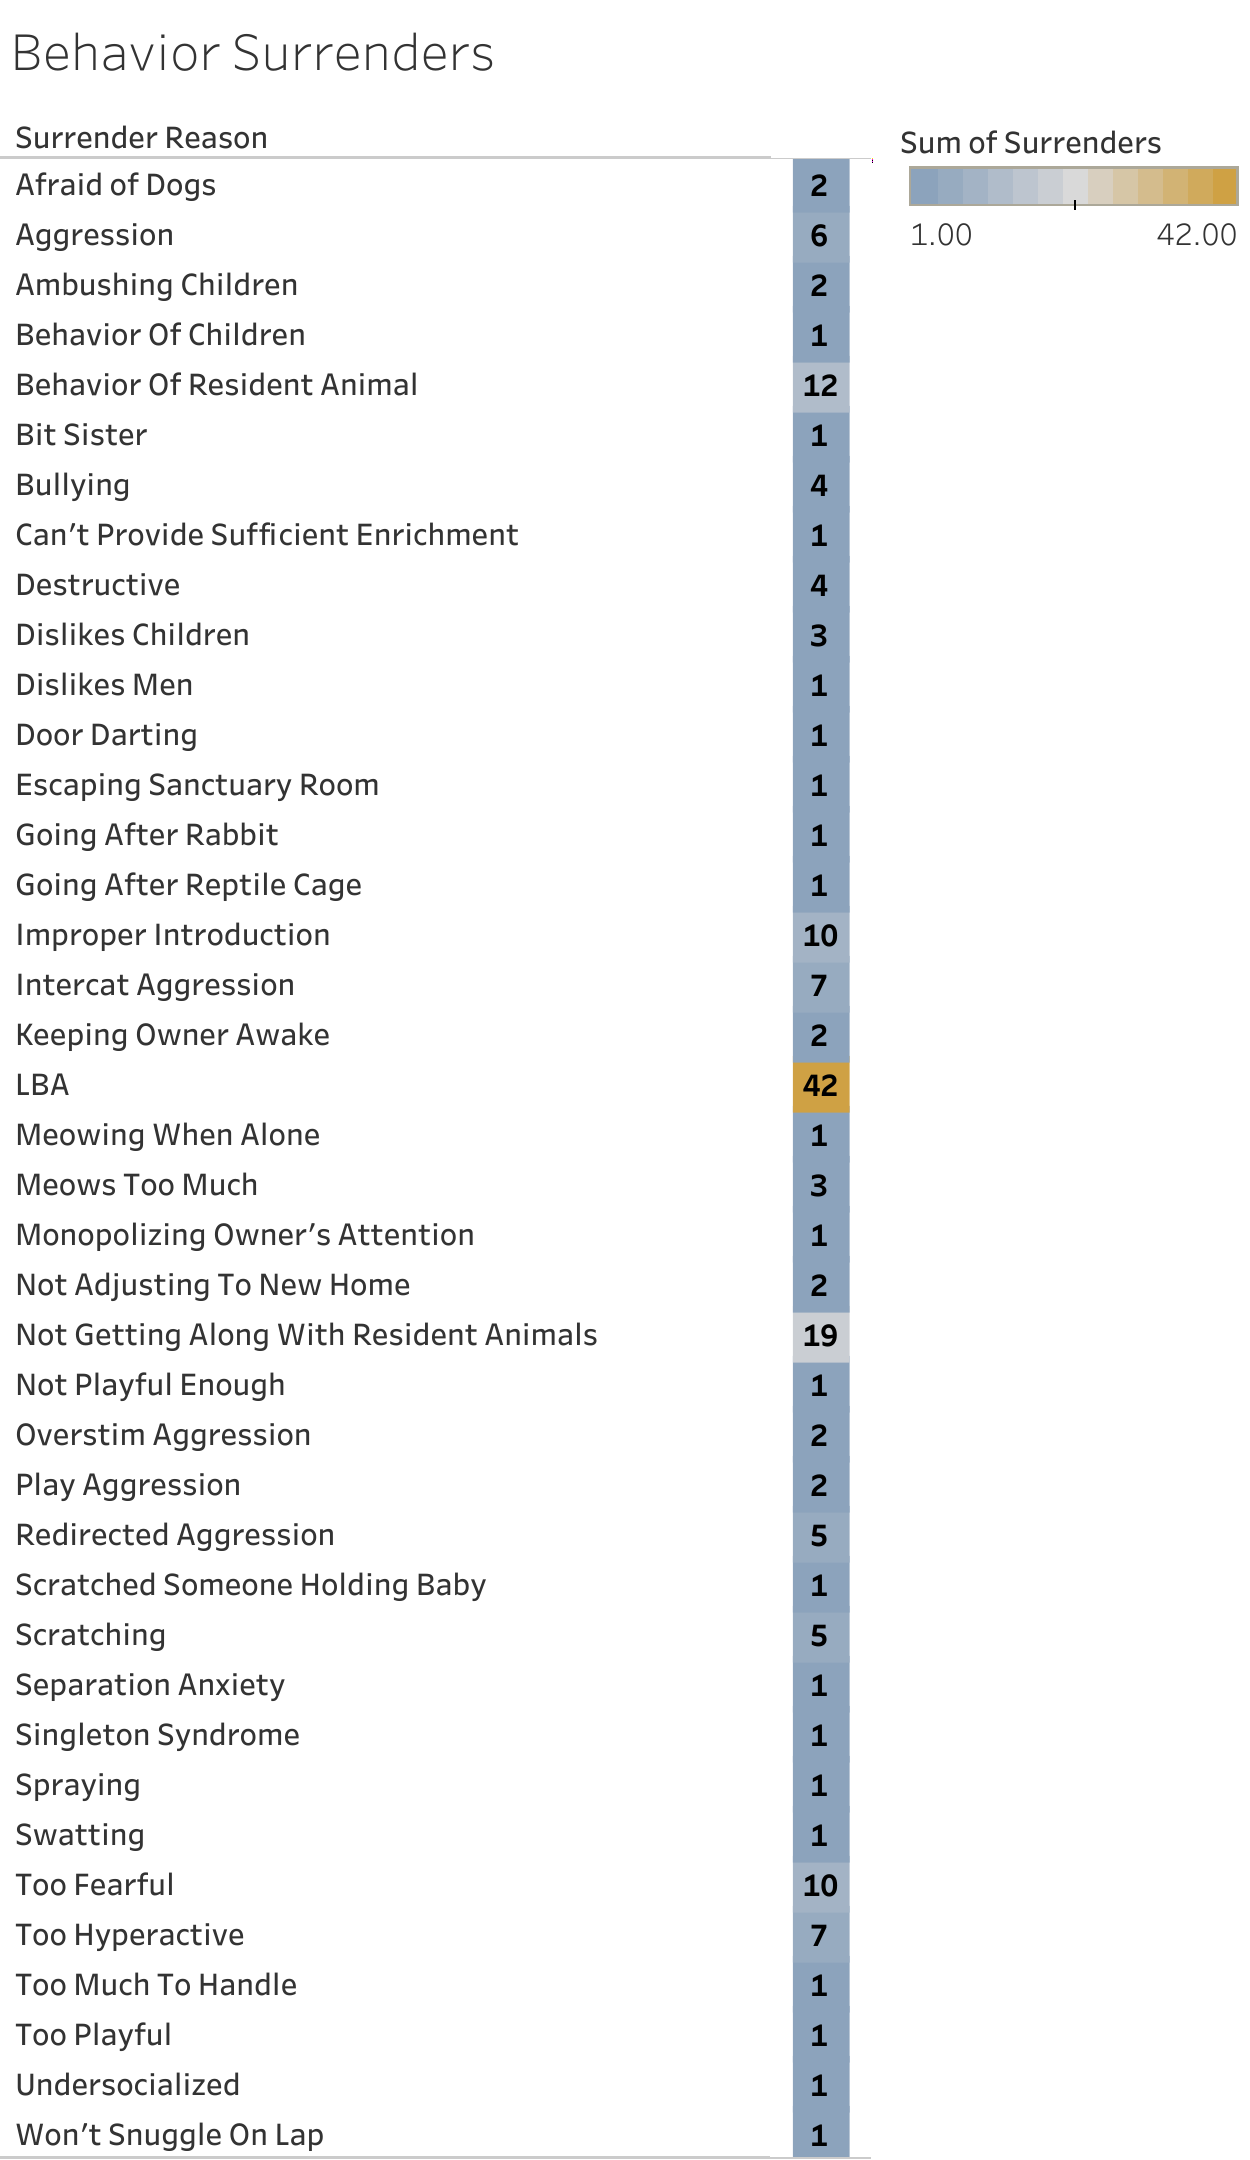
Following this, I decided to separate Behavior surrenders into their own category, as that is truly what's most important to my position. I want to check a few things here: What are the most common behavior reasons? Are these clients being consulted? What percentage of our surrenders are behavior-related, and what lie out of my hands? Admittedly, this viz is a bit congested - but you can still see that Litter Box Avoidance is by far our highest surrender reason when it comes to behavior, followed by an inability to integrate with the resident animals, fear of other animals, and aggression between cats.
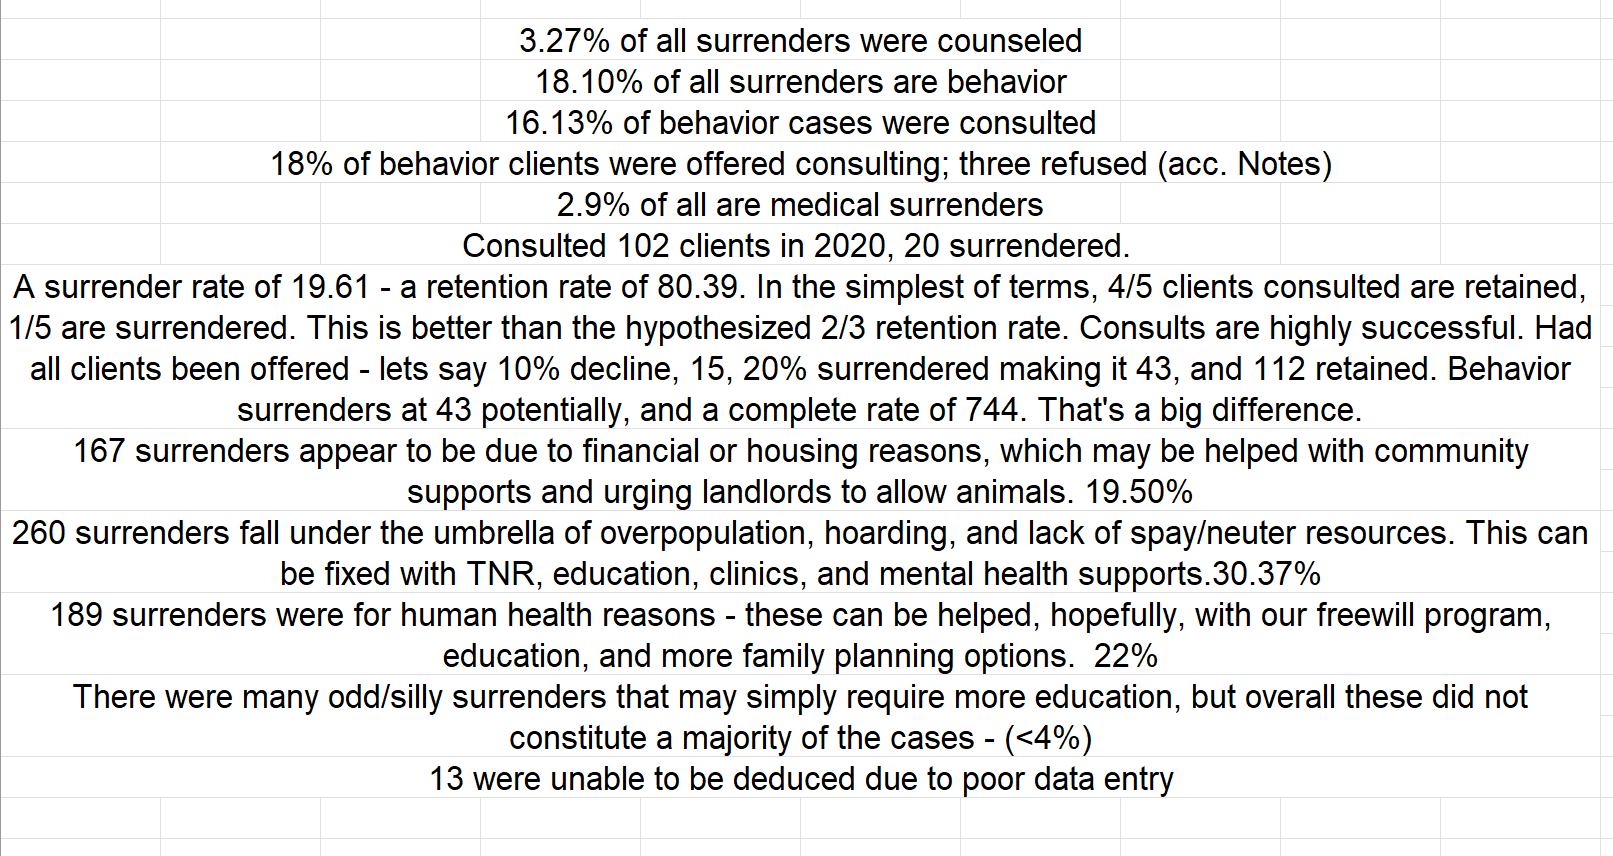
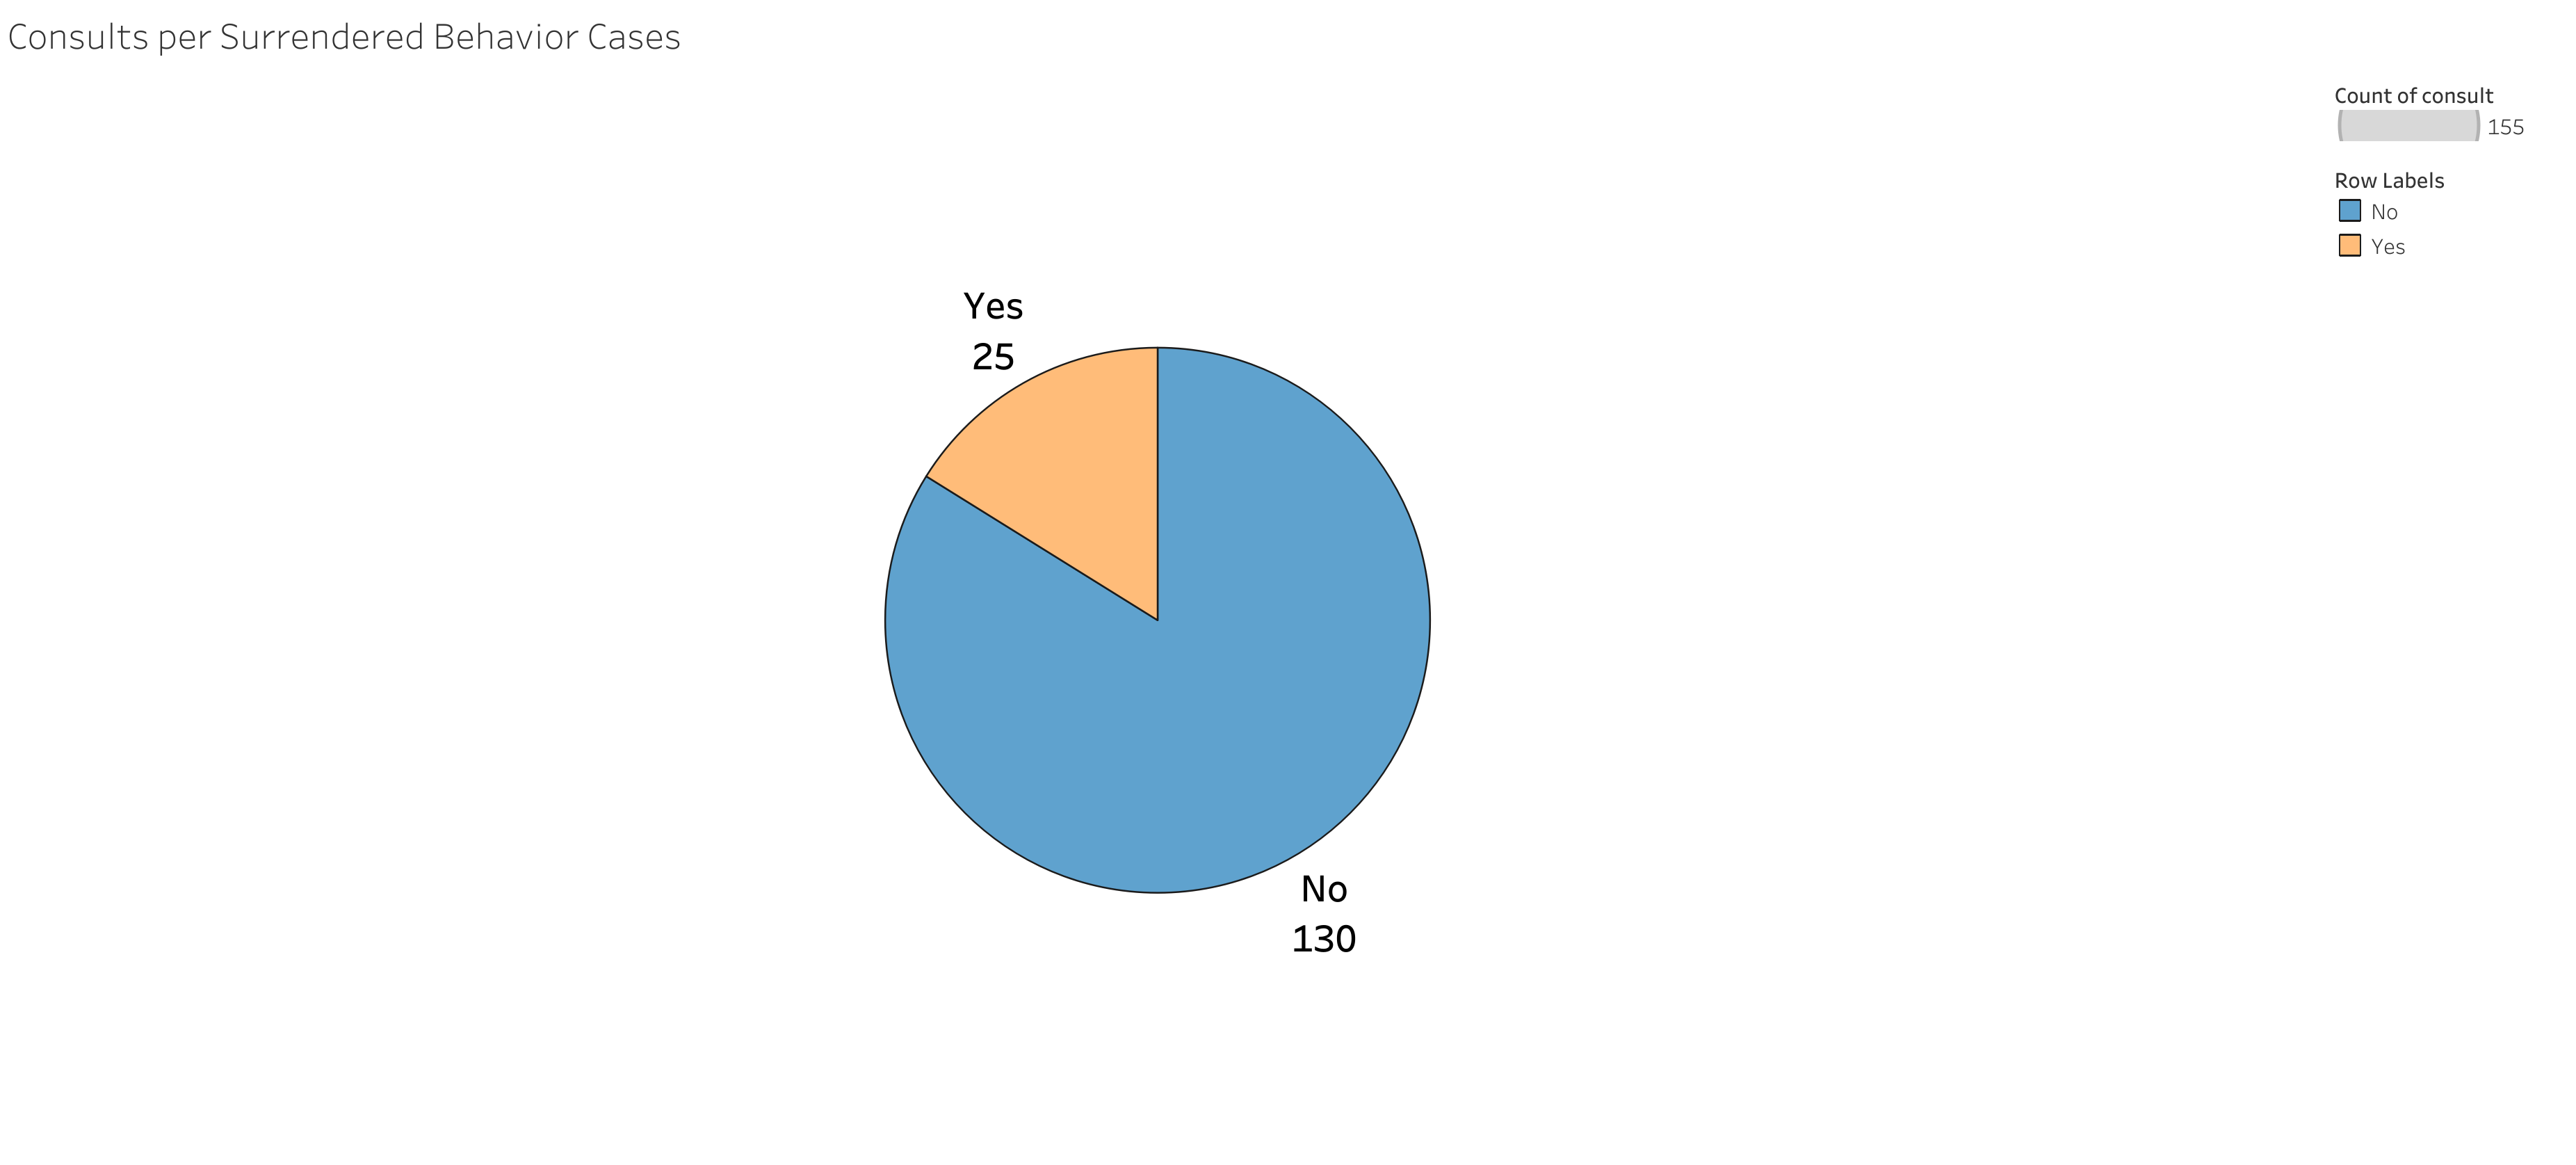
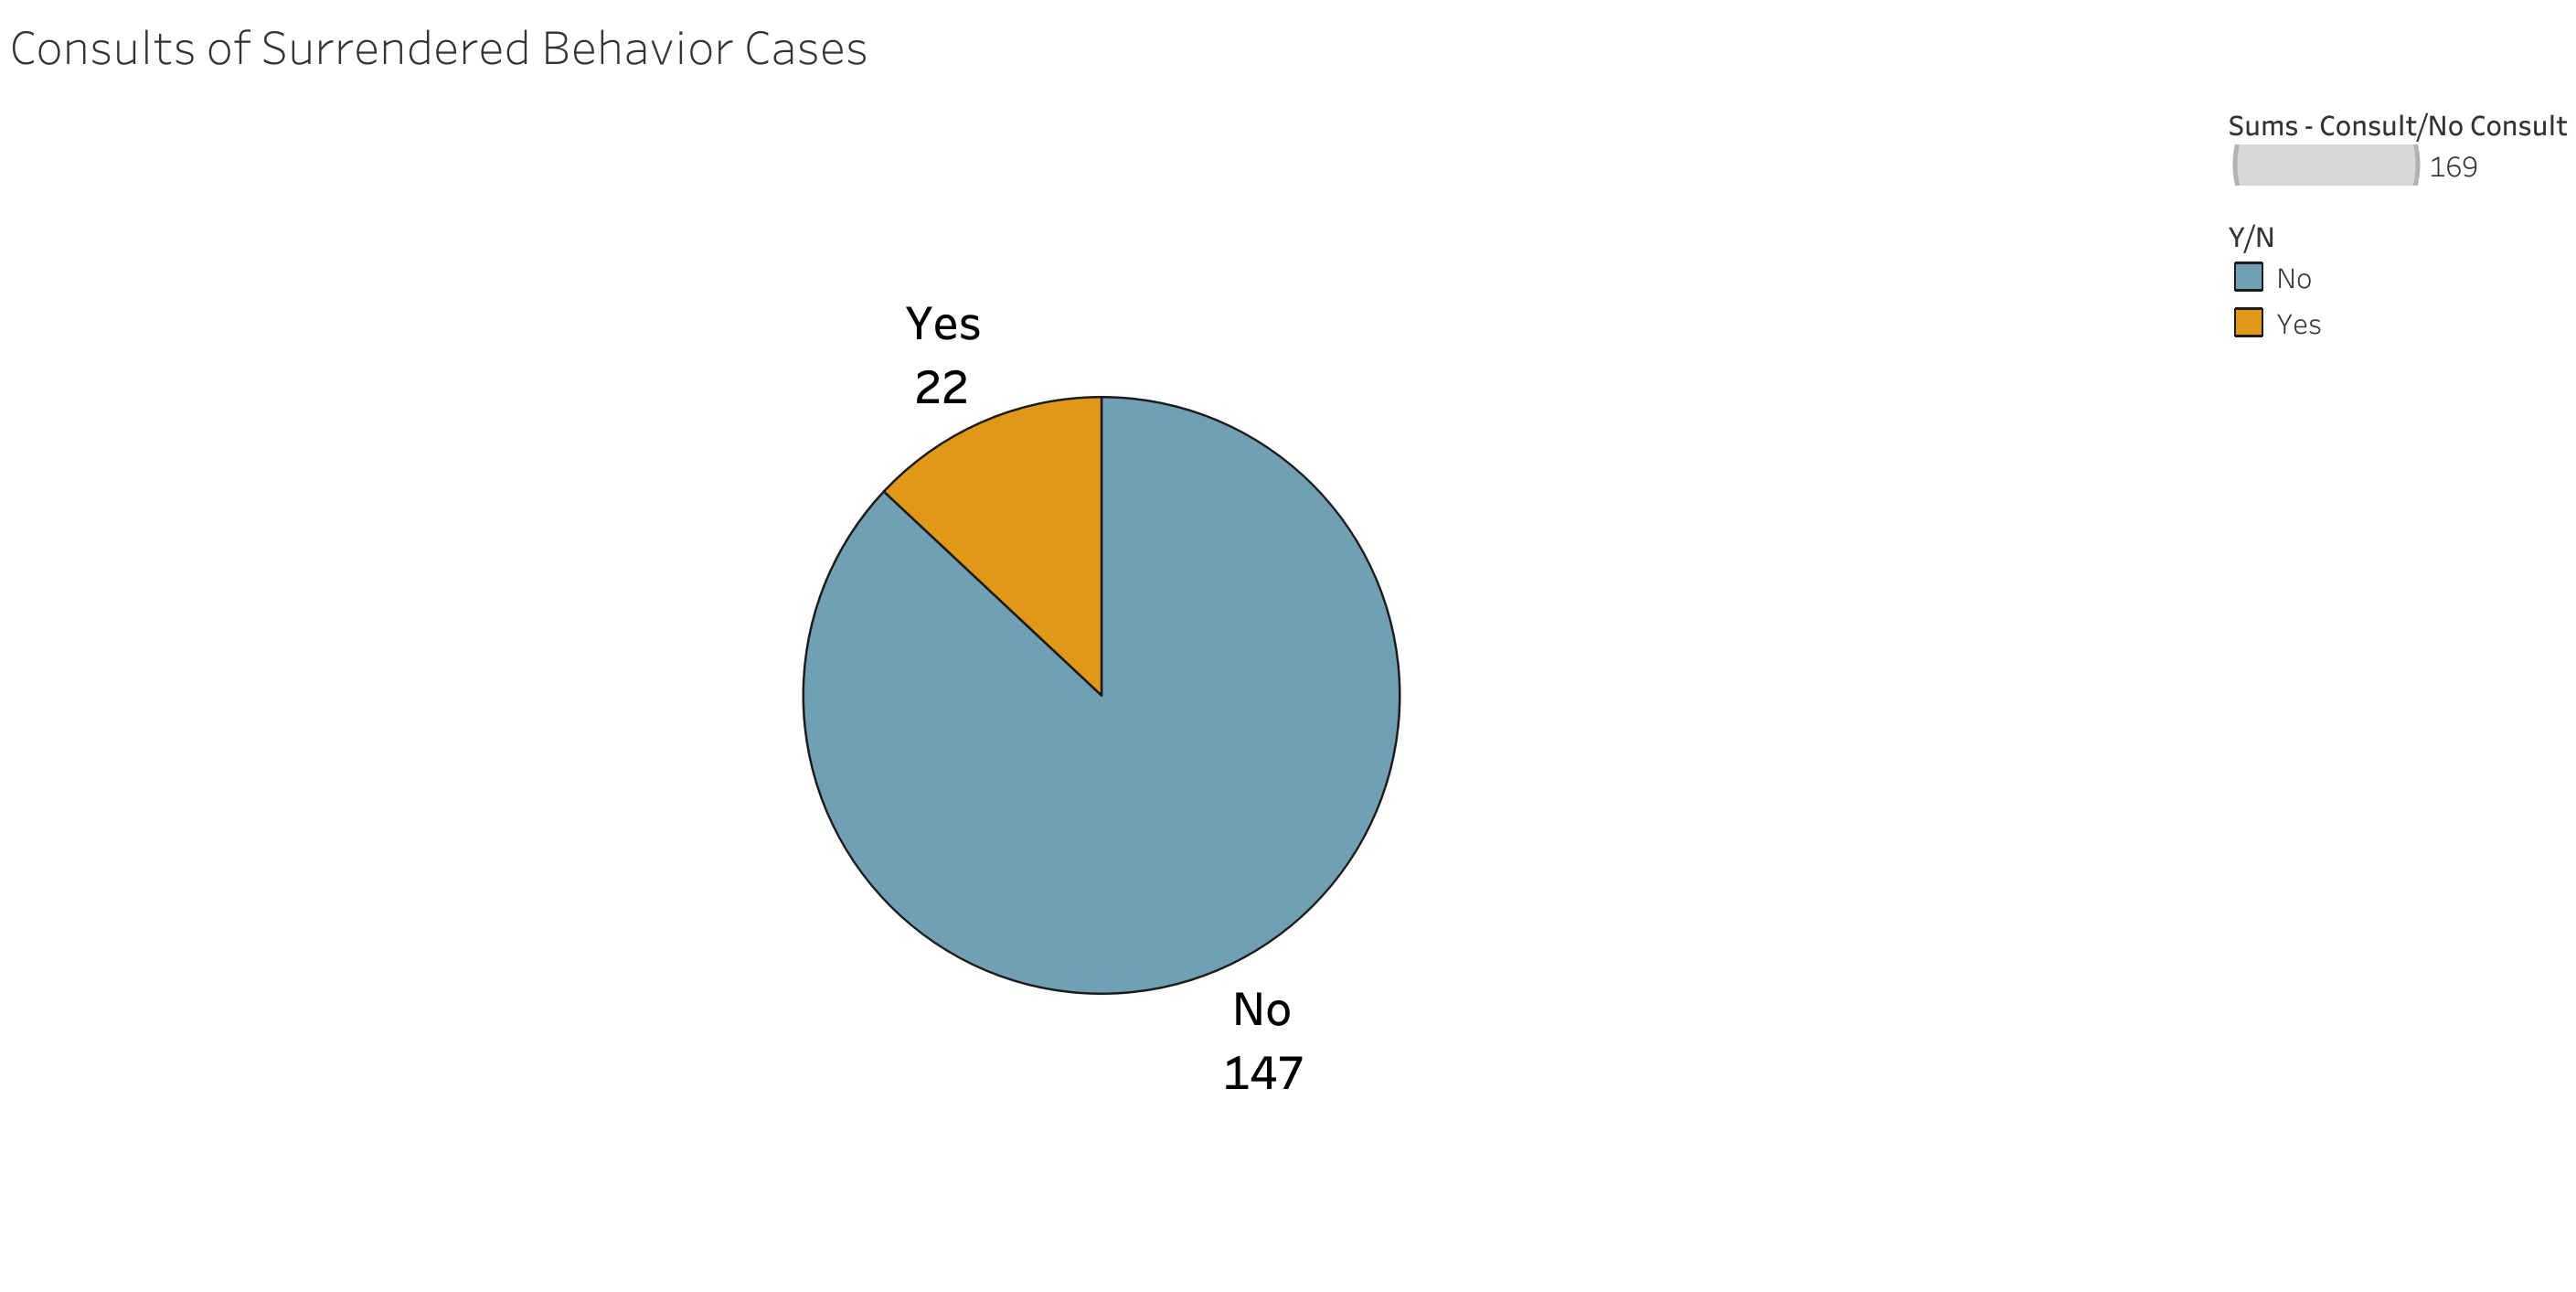
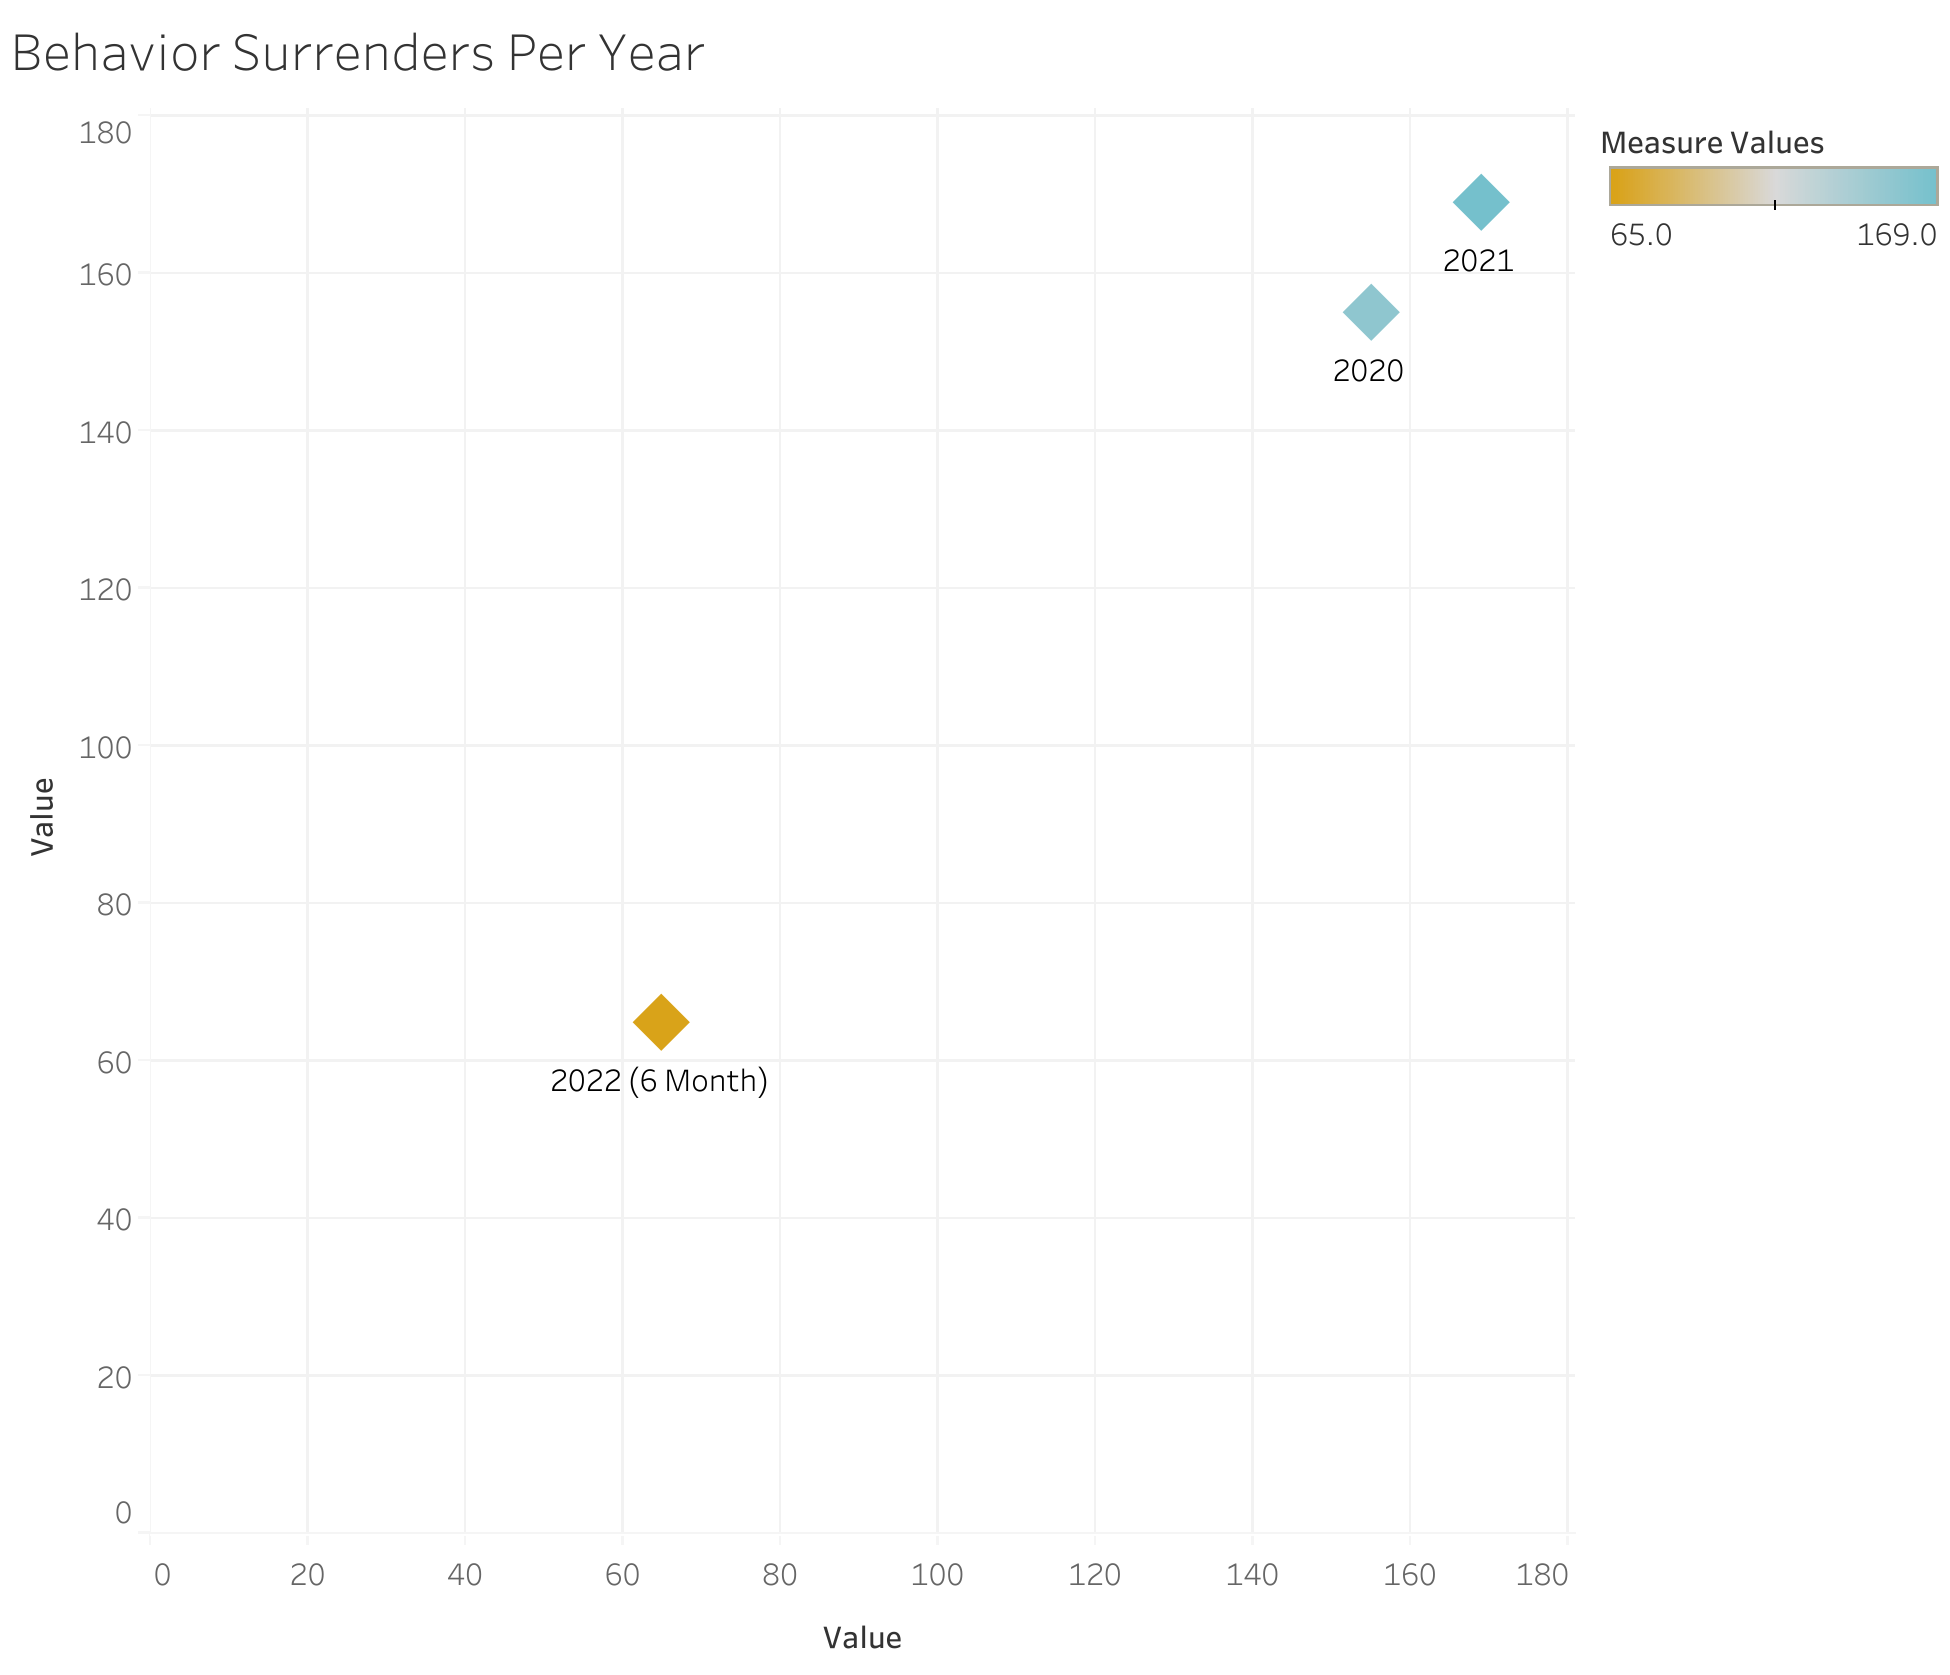
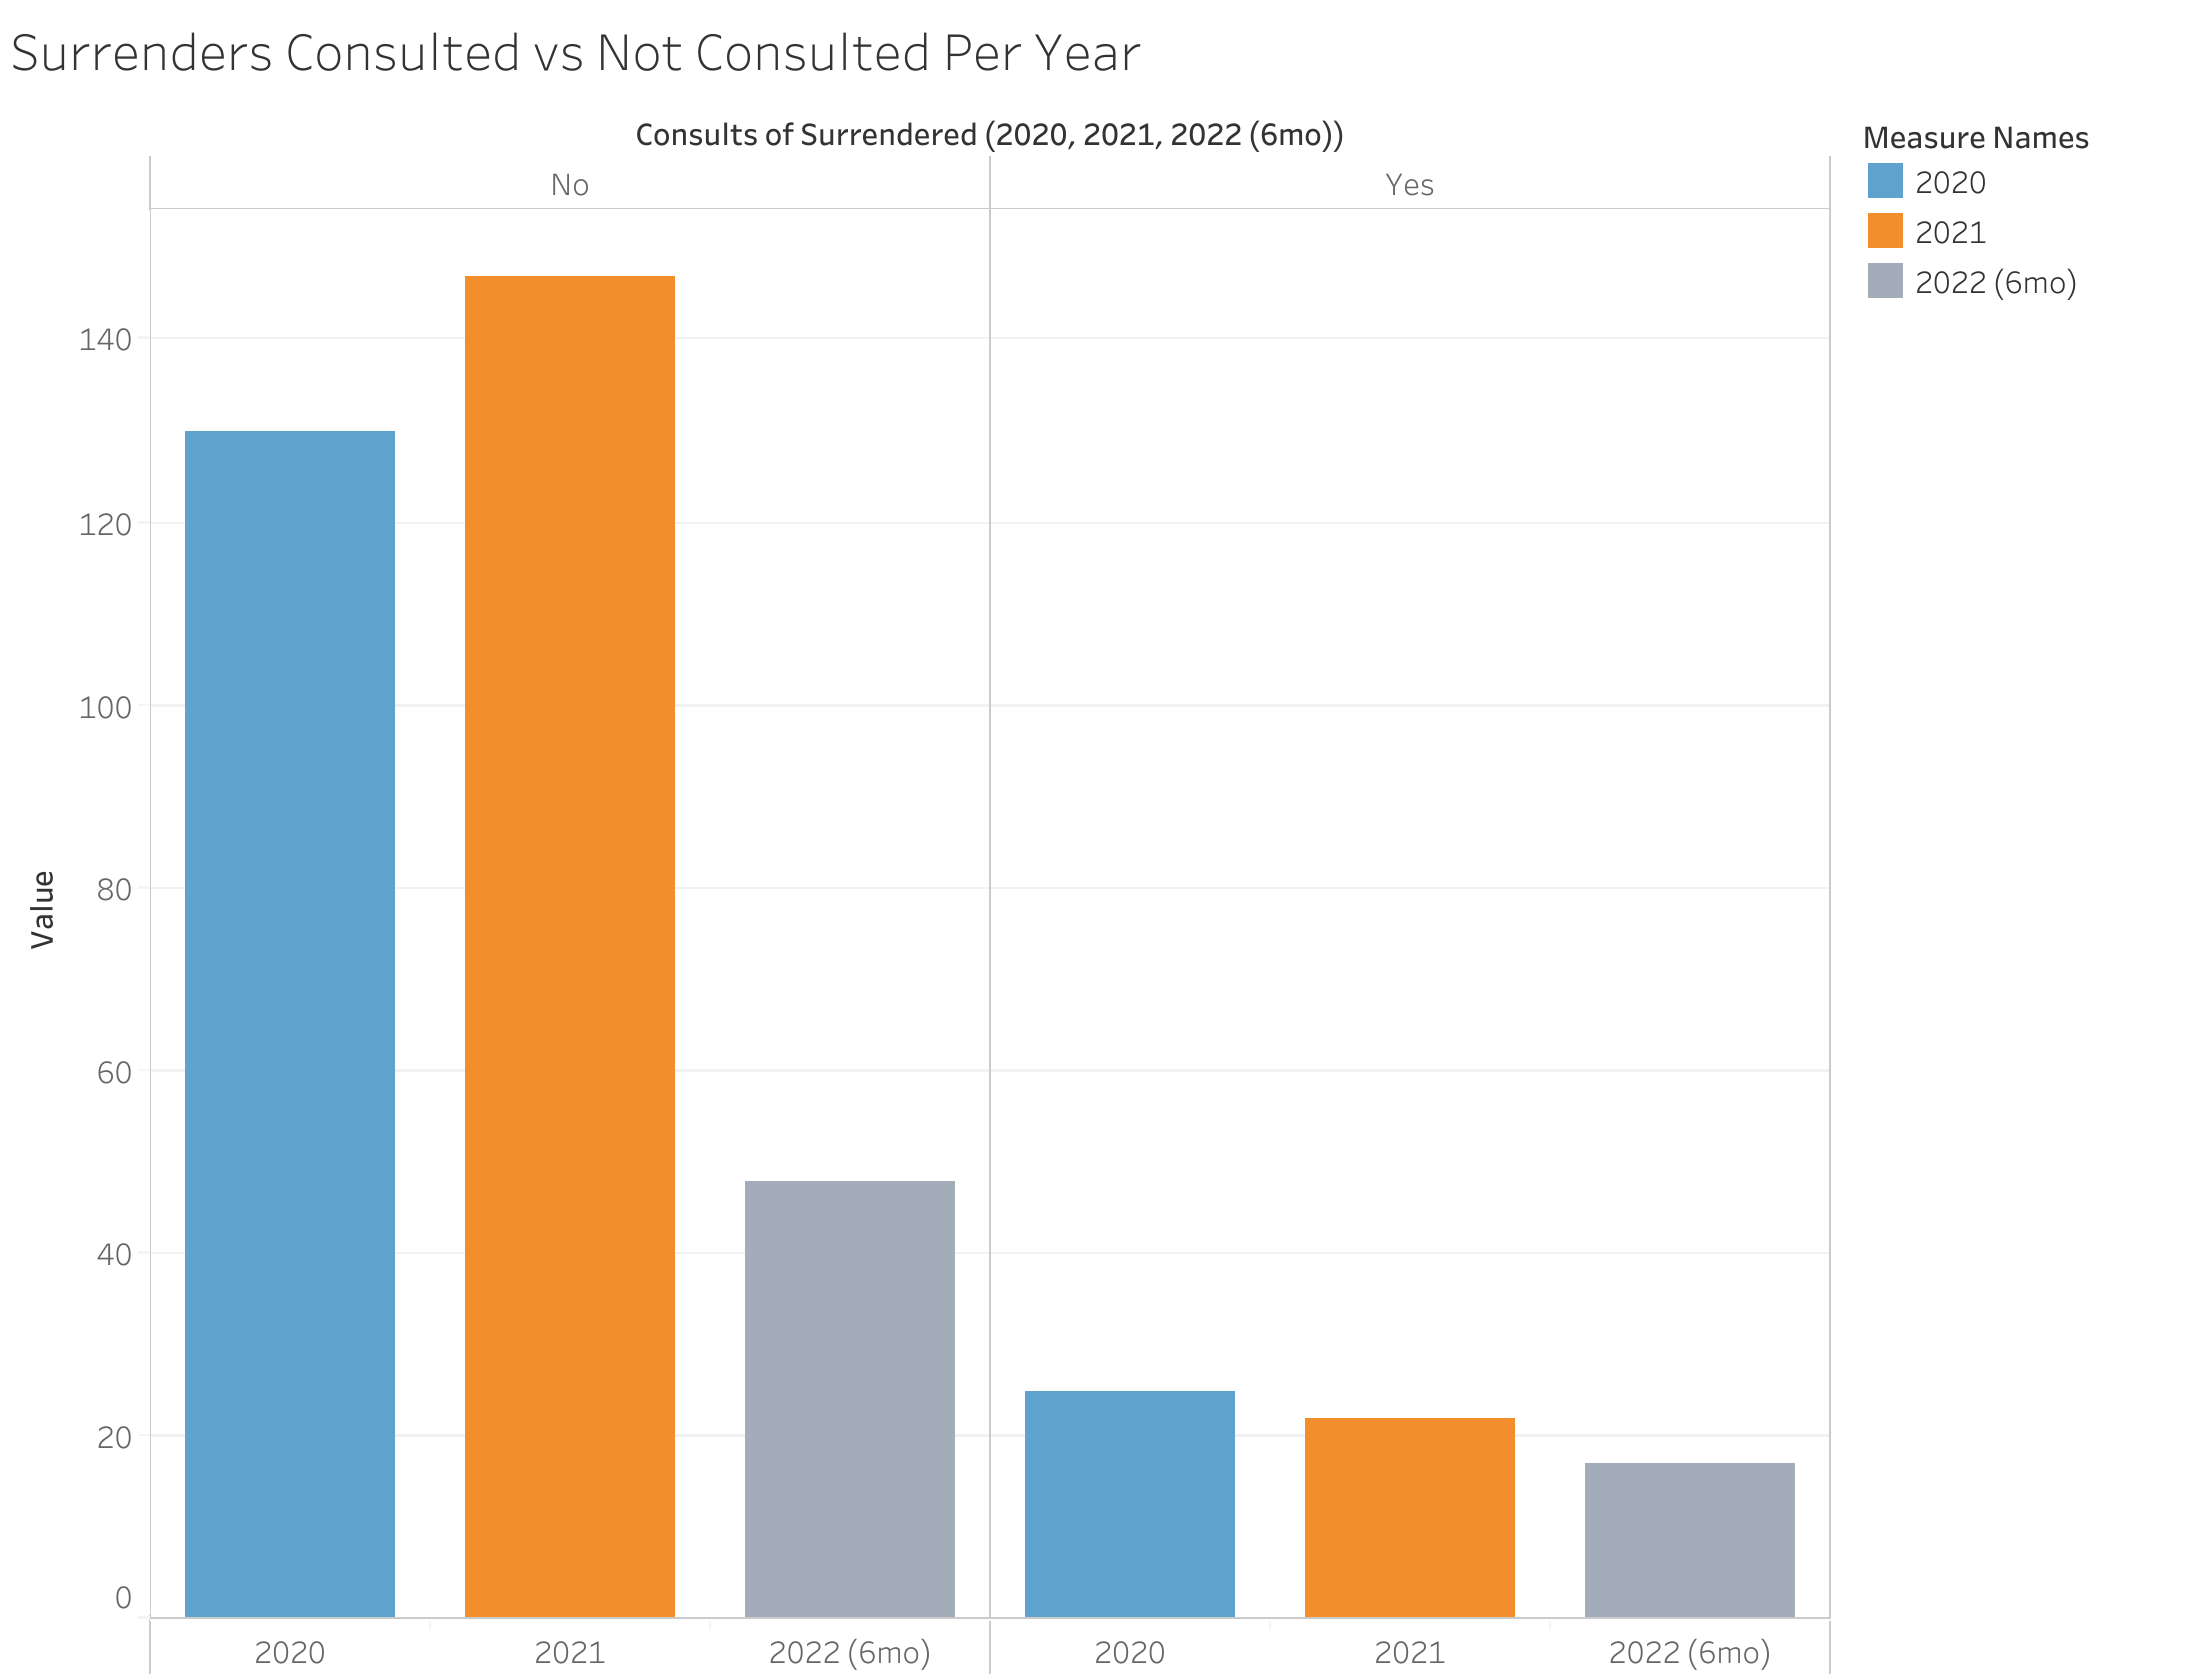
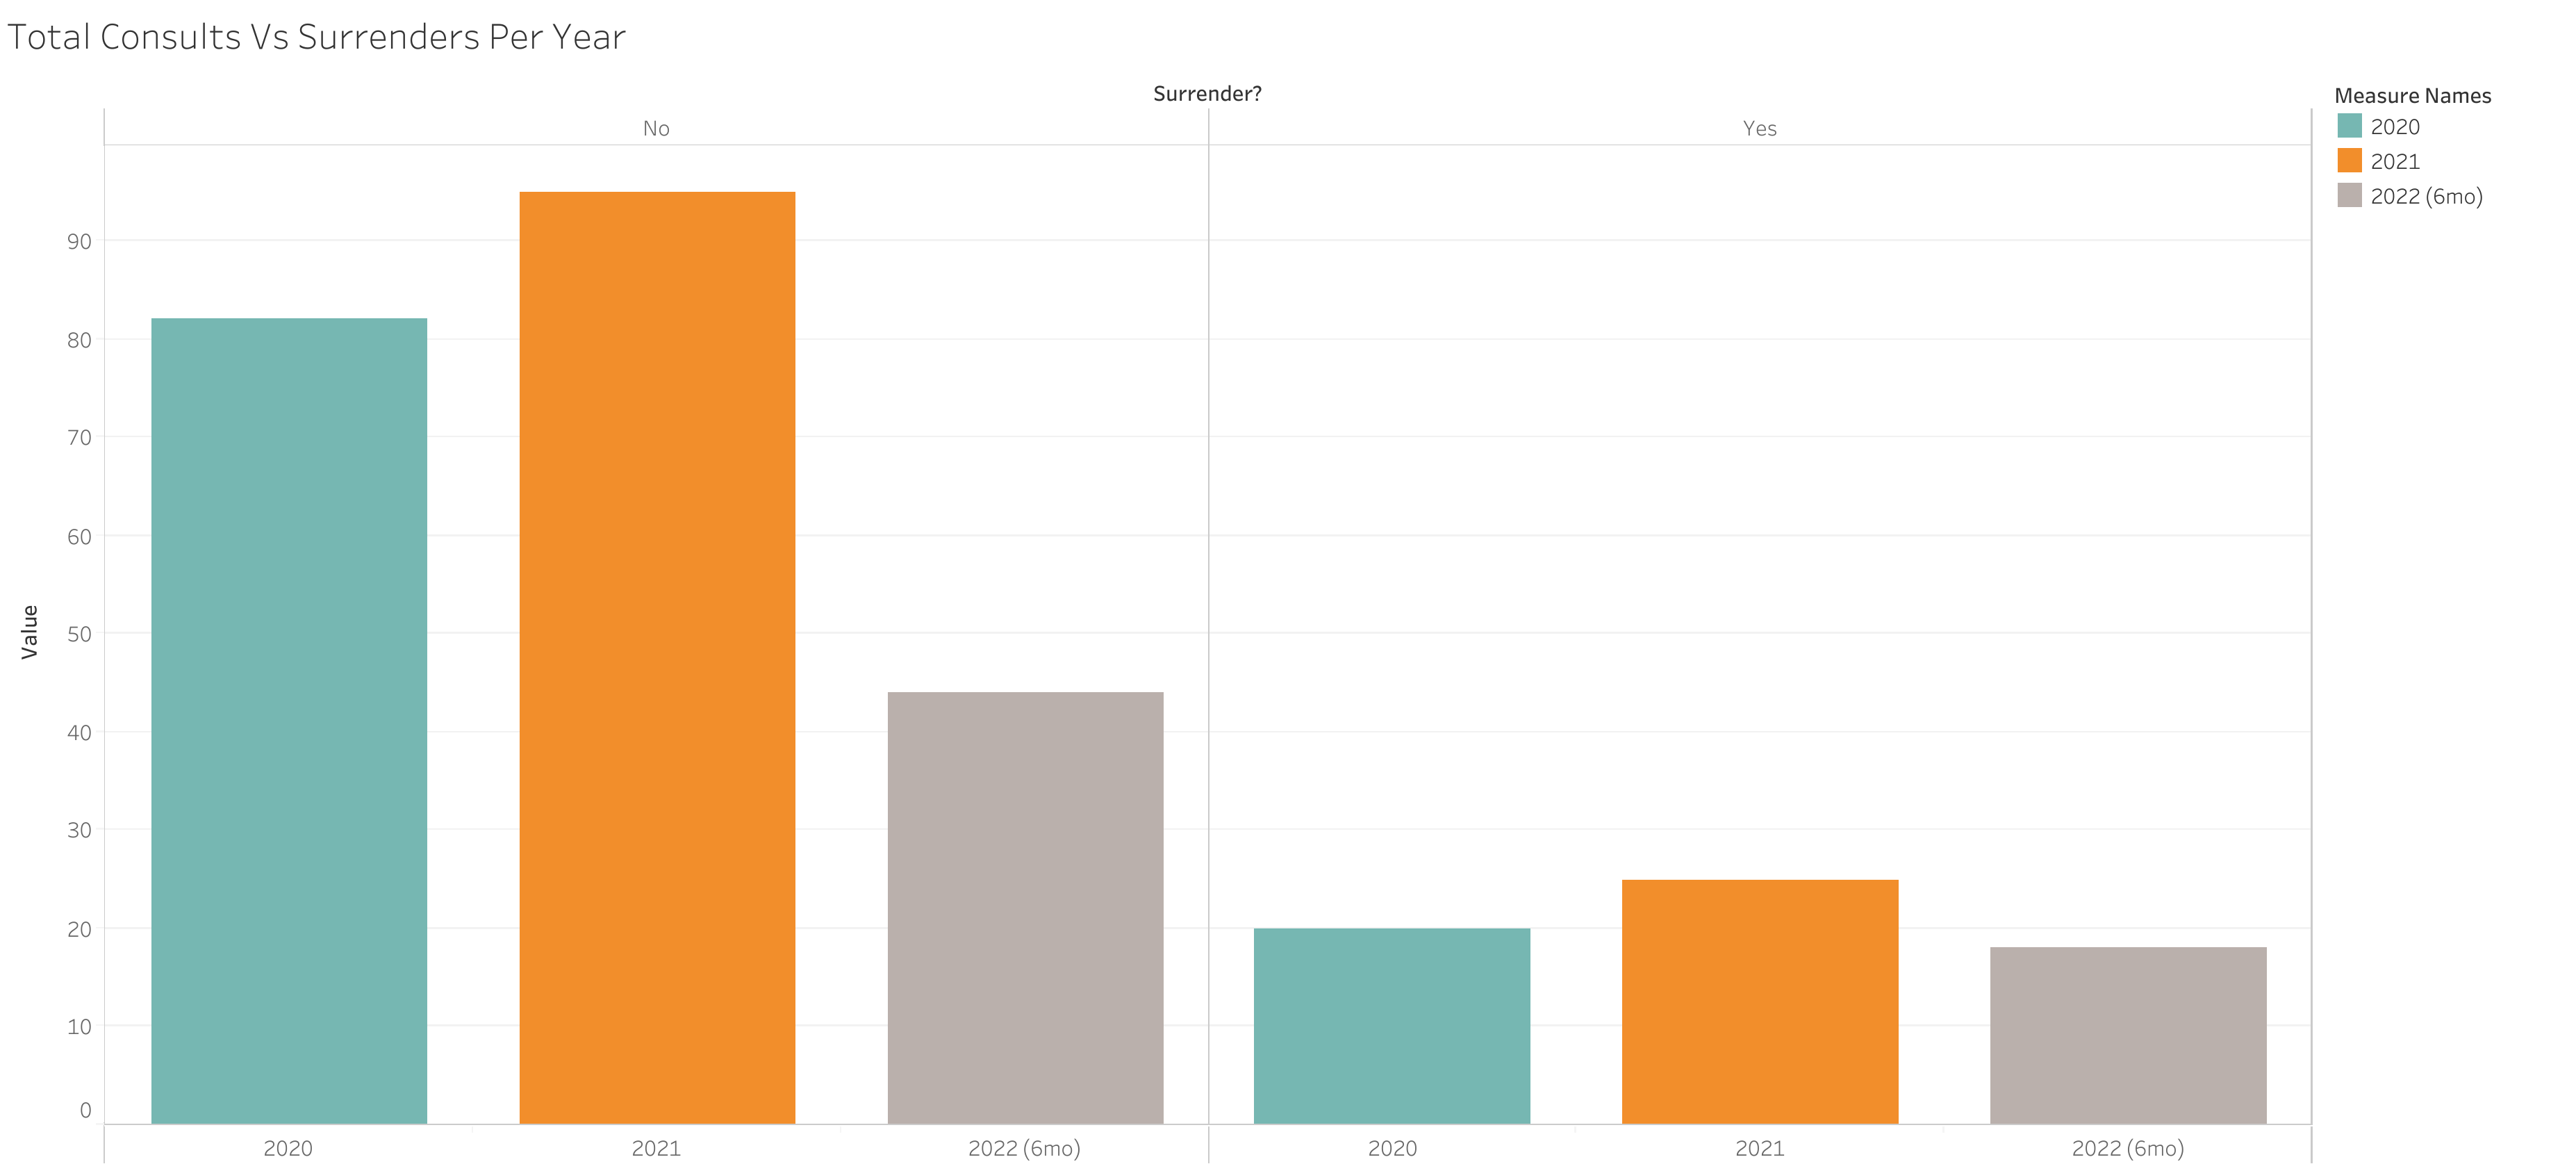
155 surrenders were due to behavioral issues, that's about 18% of all surrenders - much lower than would be anticipated. 18% of those clients were offered behavioral consulting, and we have record that three of those refused, meaning that ~16% were consulted. These are not great numbers - we would hope the offer lies around 100% - and to always have a record of refusal. If this reporting is accurate, we are falling short.
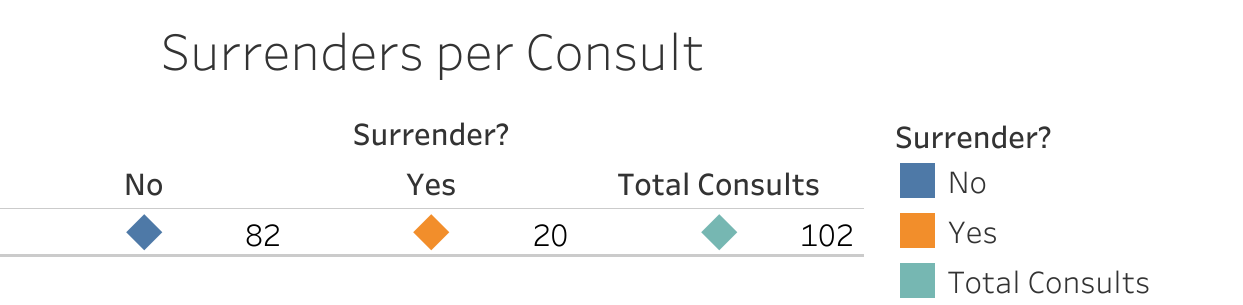
My departmental records show that I consulted with 102 clients in 2020, of which 20 surrendered after consult. That gives my program a retention rate of around 80% for the year of 2020; or 4 out of 5 keep their animal. I speculated through this data that if all clients had been offered behavioral help, and a generous estimate of 10% refused, we would still be able to keep an additional 112 animals out of the shelter.
Next, I broke up the rest of the data into categories. There were quite a few "silly" surrenders that didn't particularly fit into any standard category - and therefore were excluded from these visualisations. Although fun to look at, they would not provide us much valuable information, and likely could not be prevented overall as they didn't follow logic. At 1% of surrenders, they hold little siginificance. A few still a bit "off" reasons have made it into these categories as they do, in theory, fit. "Keeps Getting Pregnant" could obviously be fixed very easily with spay surgery - which I suppose was unwanted, so can classify as a veterinary related reason.
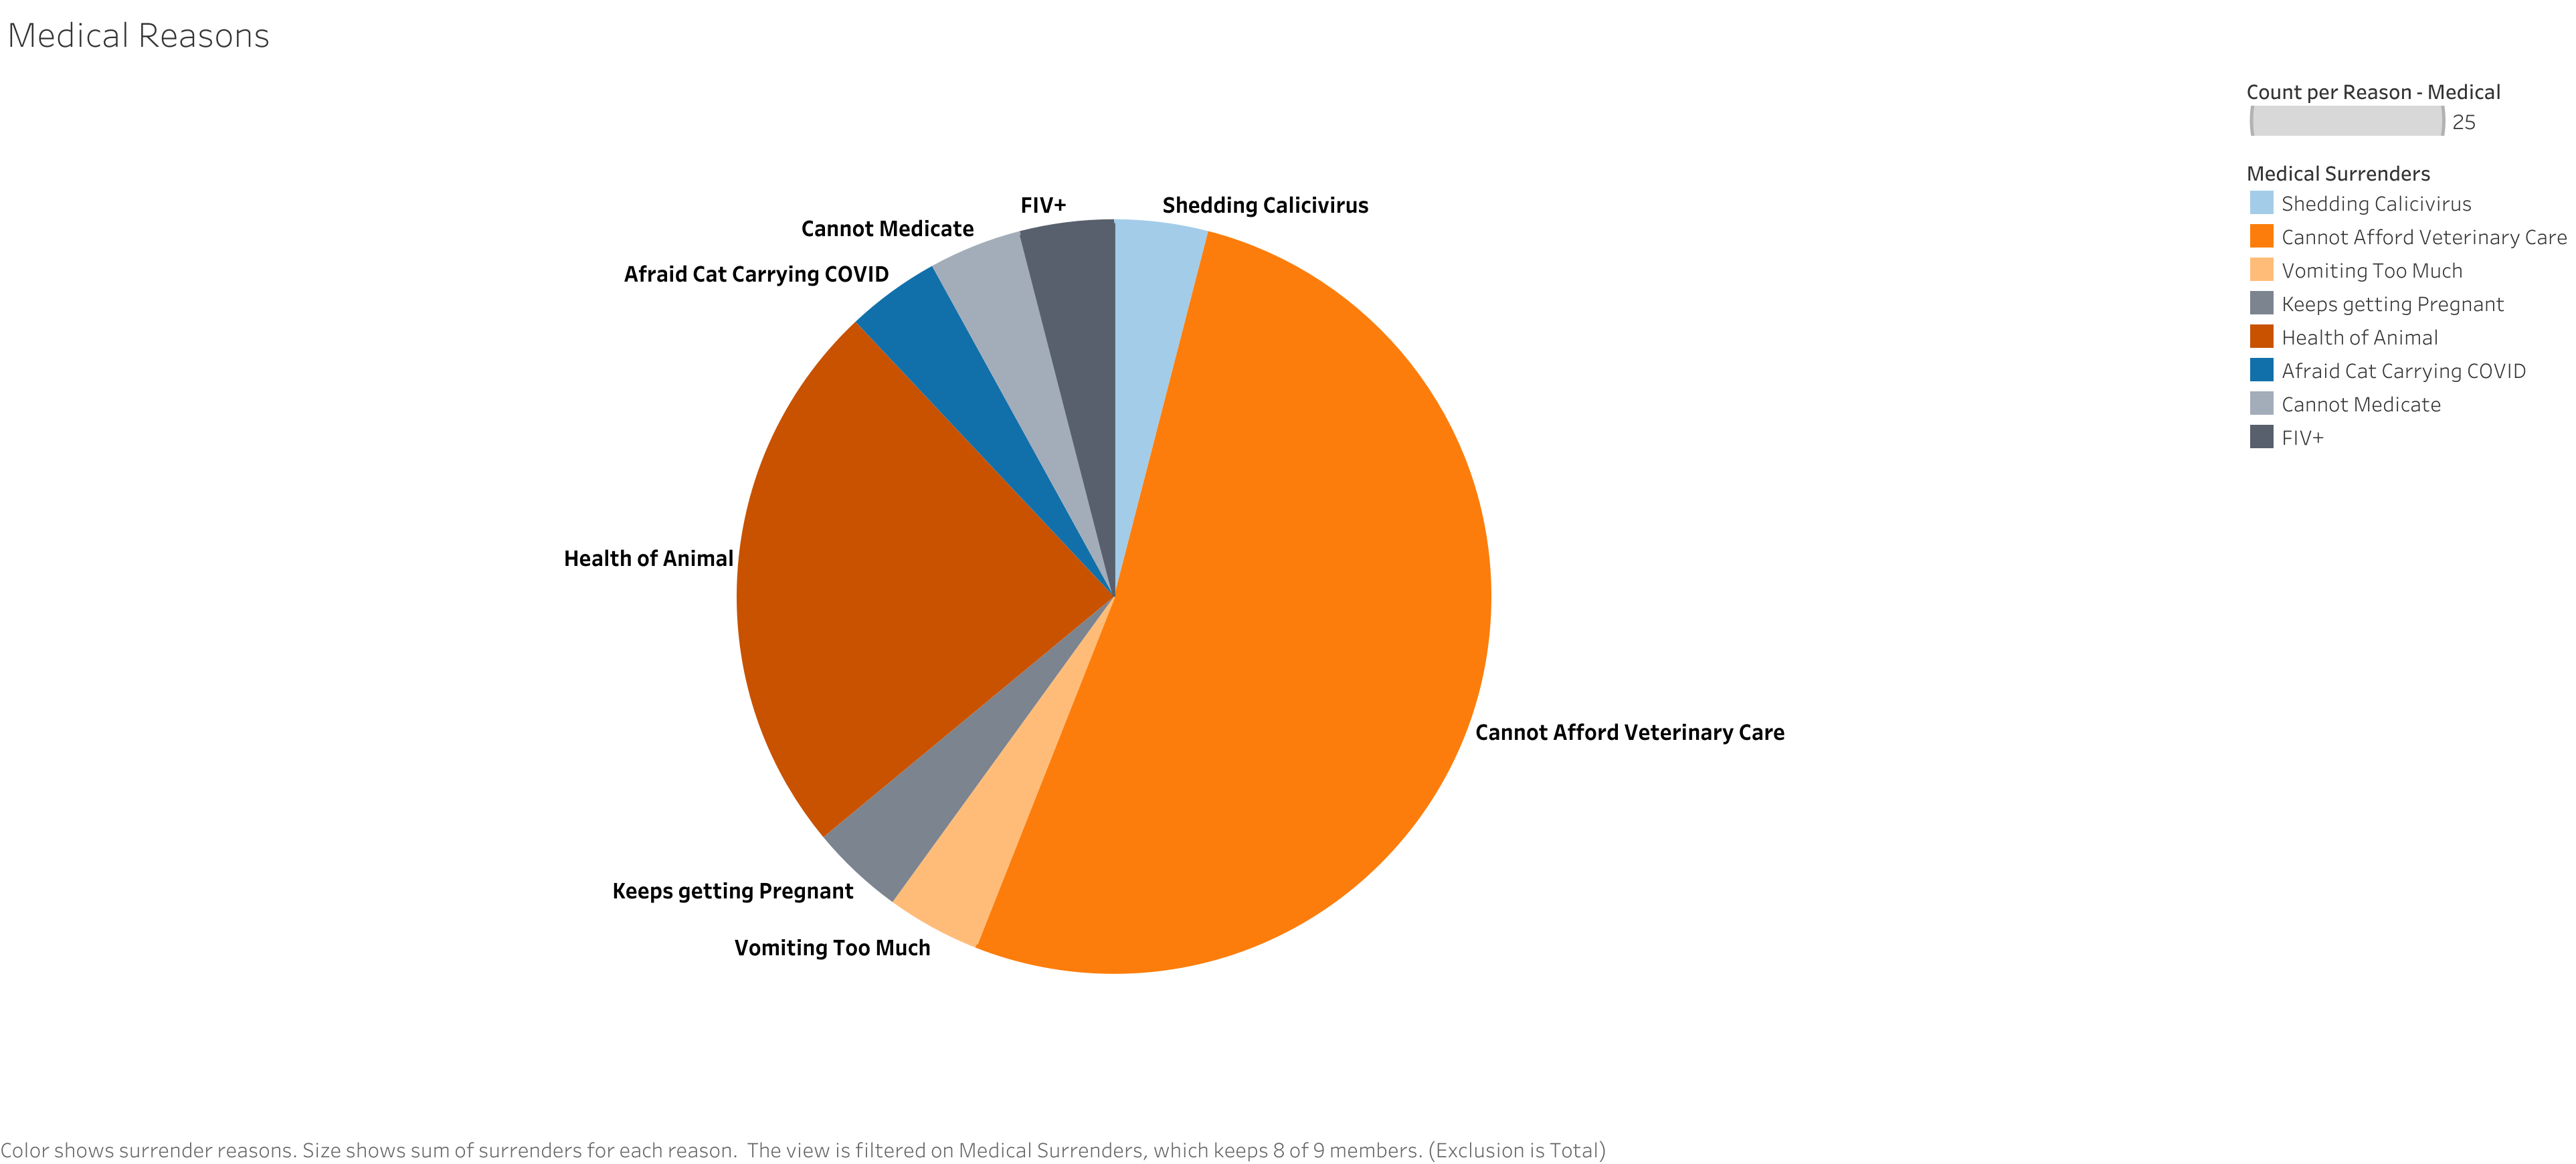
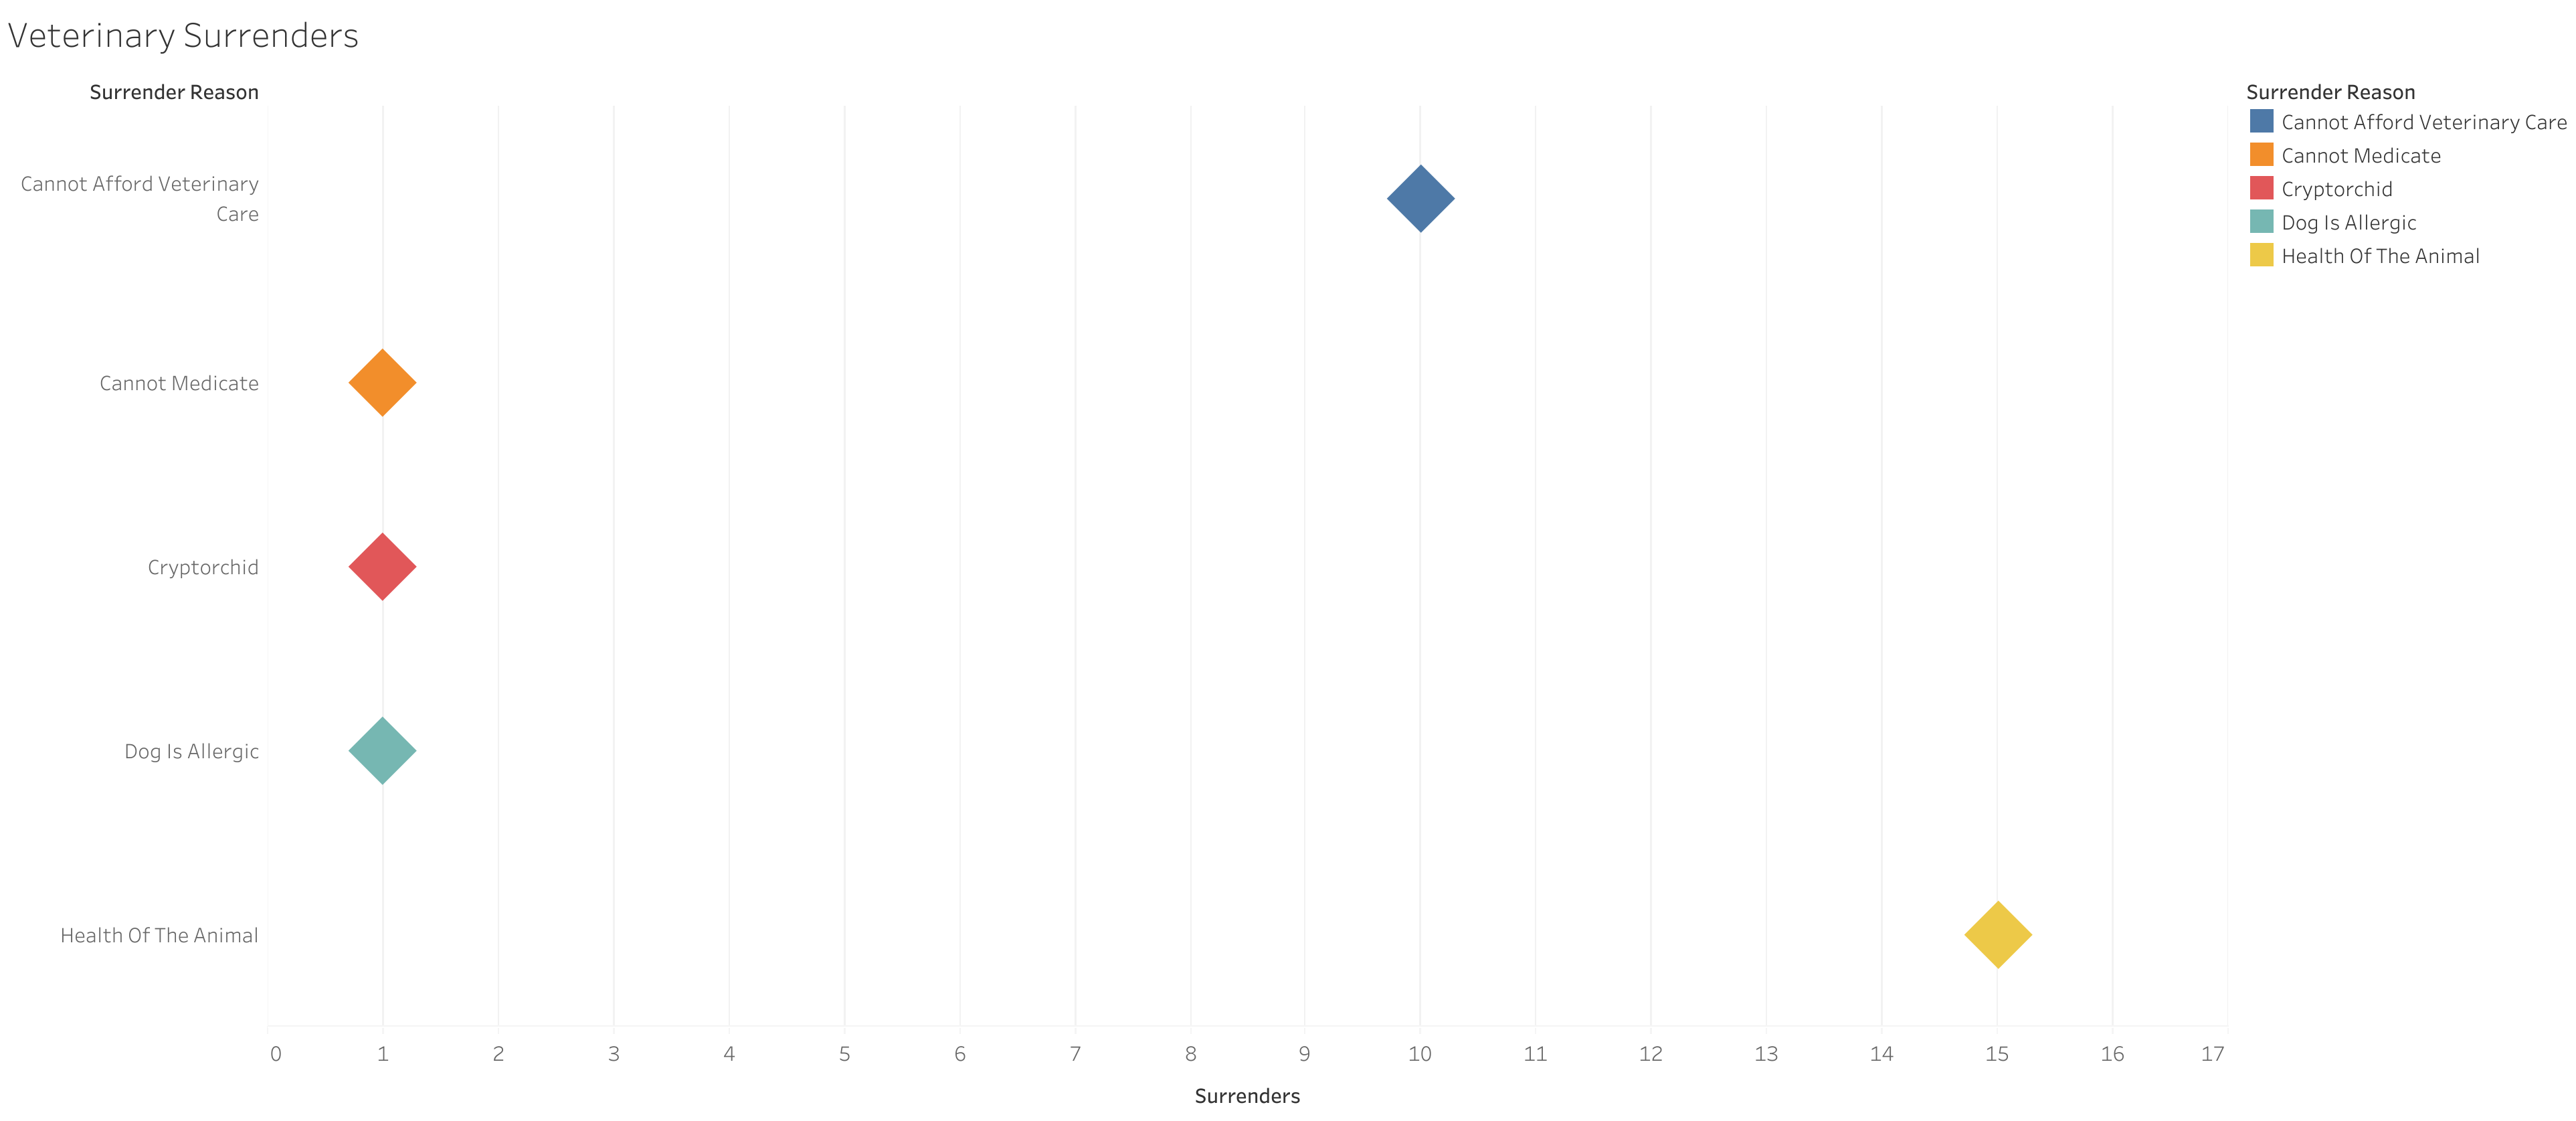
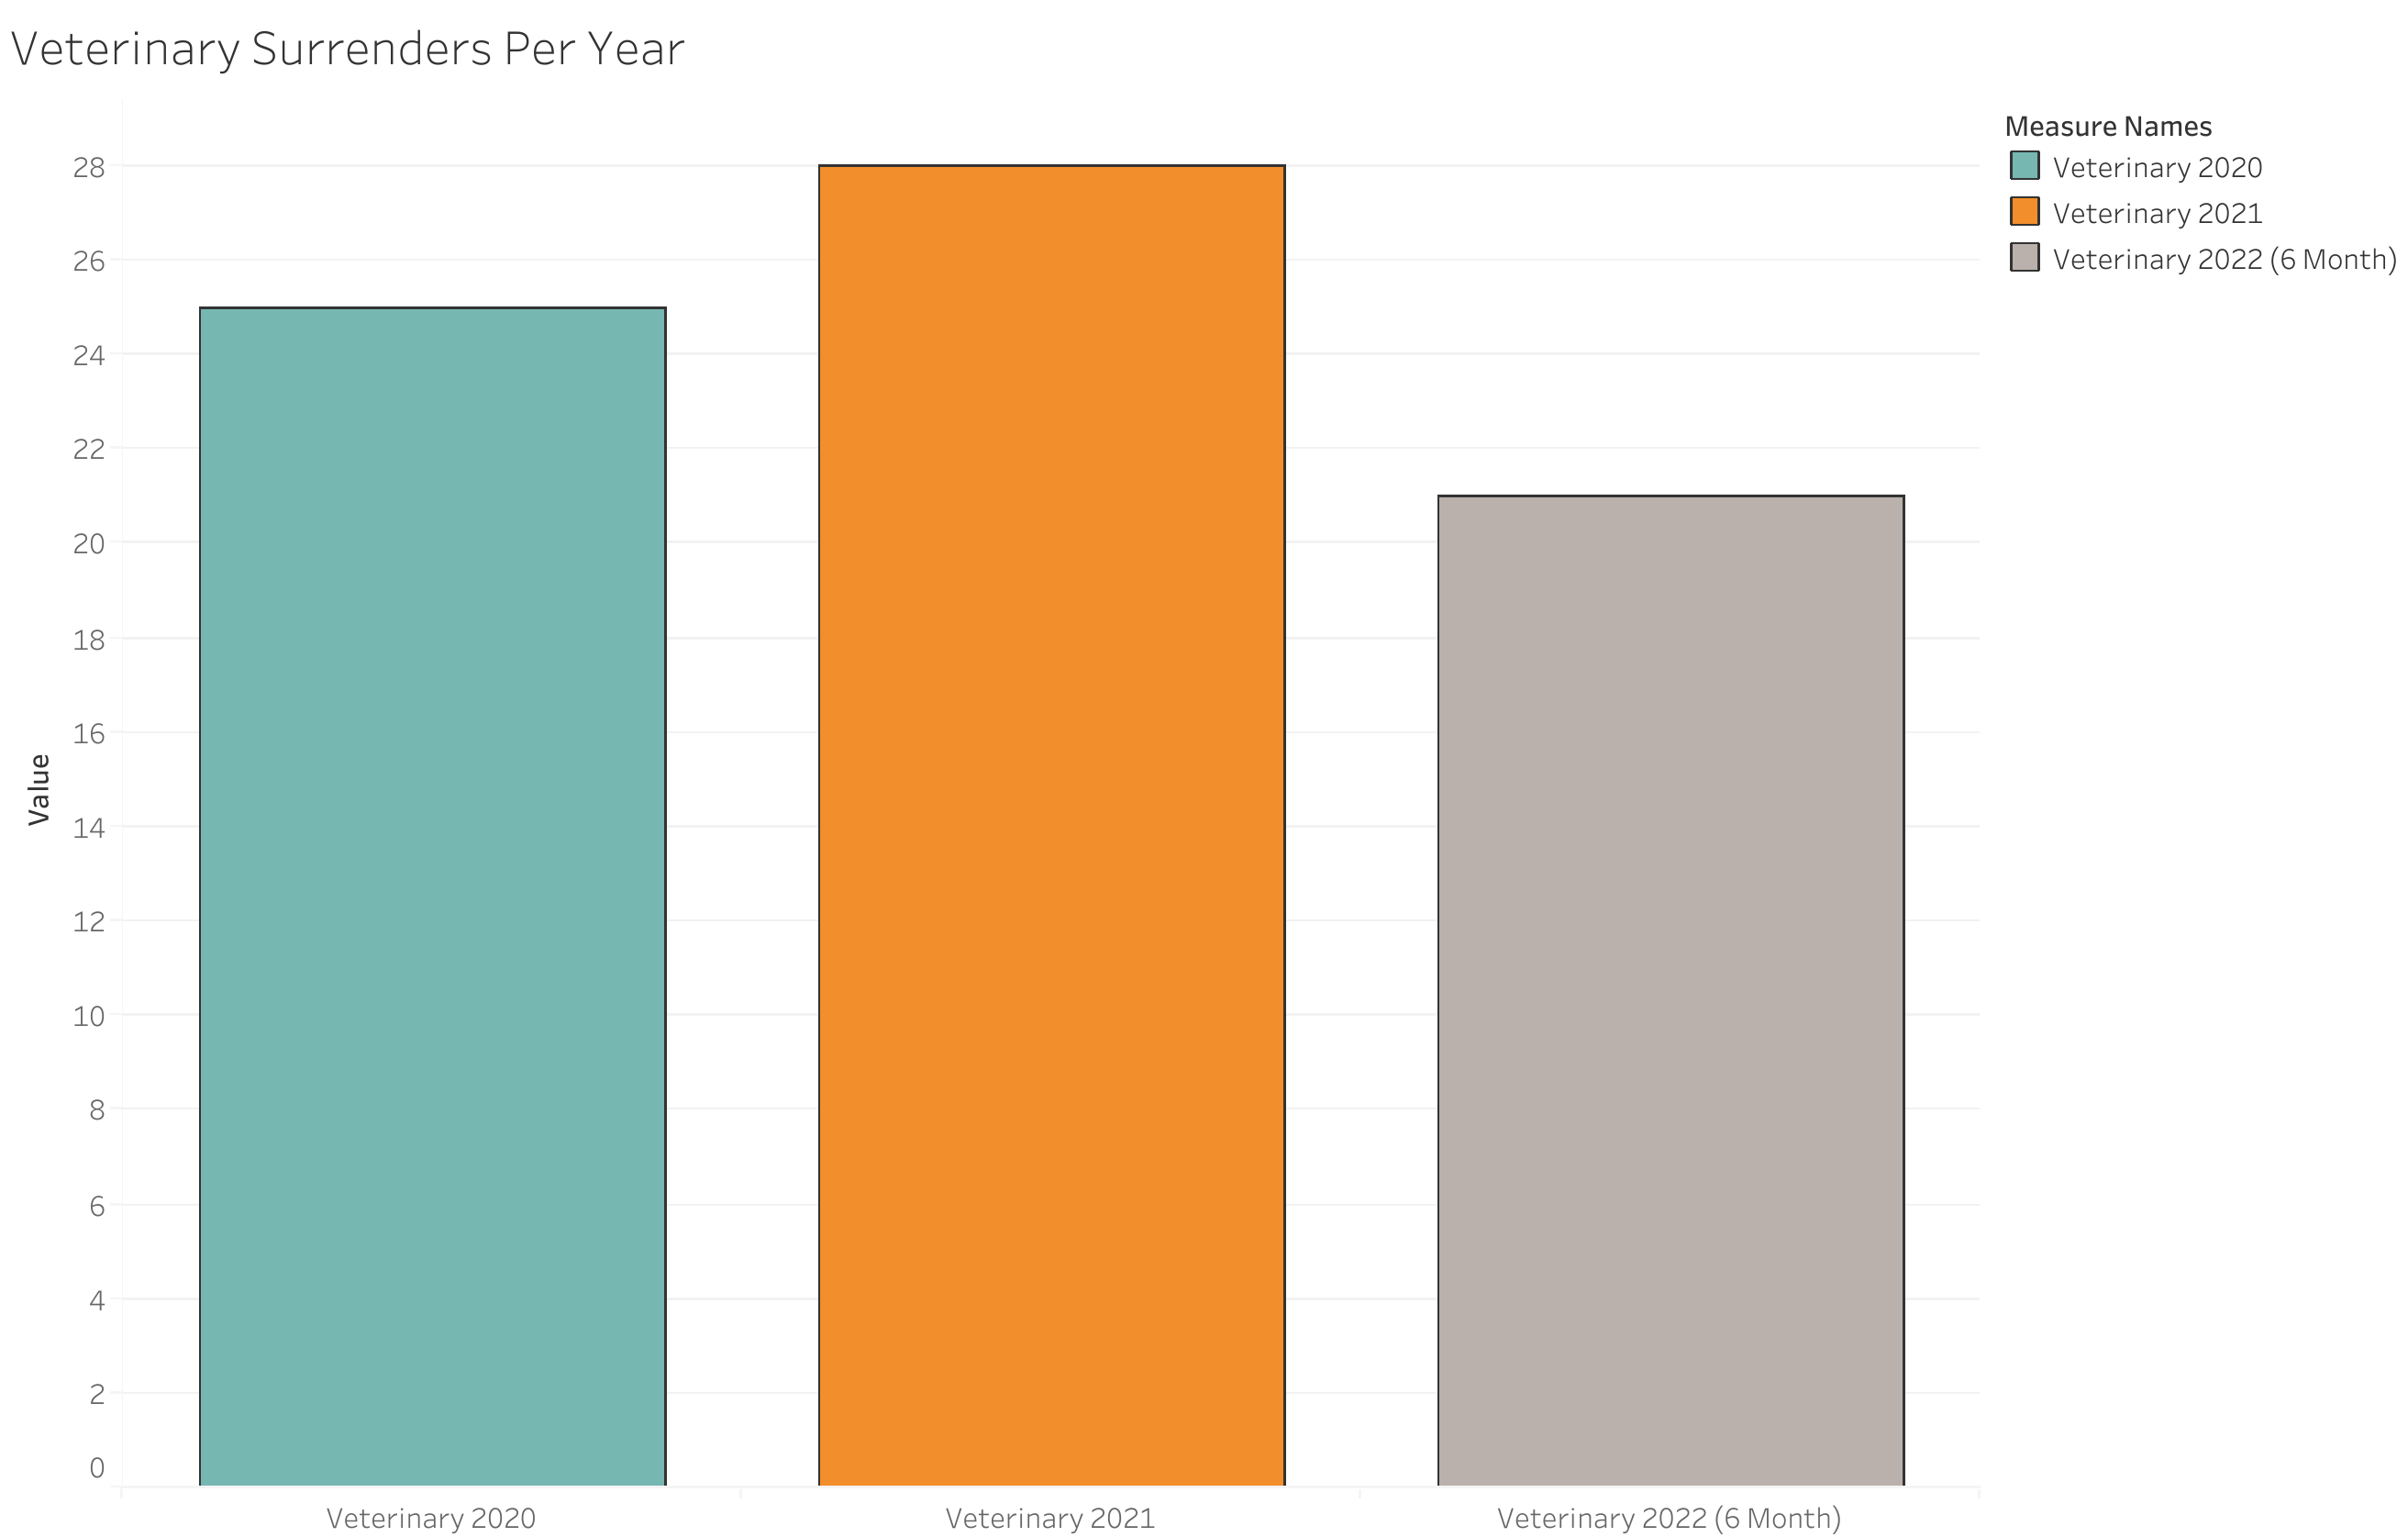
Veterinary surrenders constituted ~2.9% of our surrenders (25 total) for this year. As you can see, the inability to afford veterinary care was reported more than any other issue; therefore we could combat this by conducting more clinics, providing more low-cost services, or simply building relationships with organizations we can refer these clients to for help. (Medical grants, other low cost resources, et cetera.) Health of the Animal is a bit broad - but typically meant that the animal was in too poor of shape for the client to see rehabilitation being possible, or their specific medical needs being within their ability to handle.
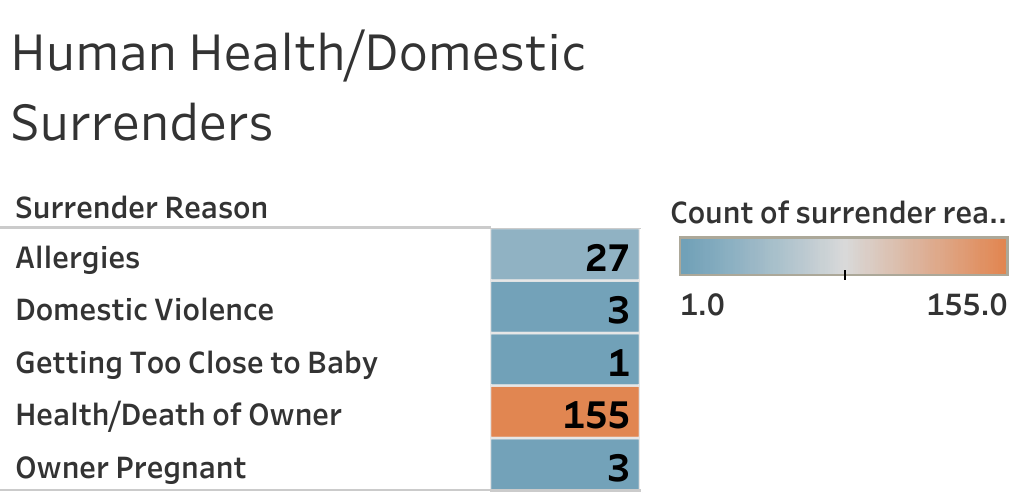
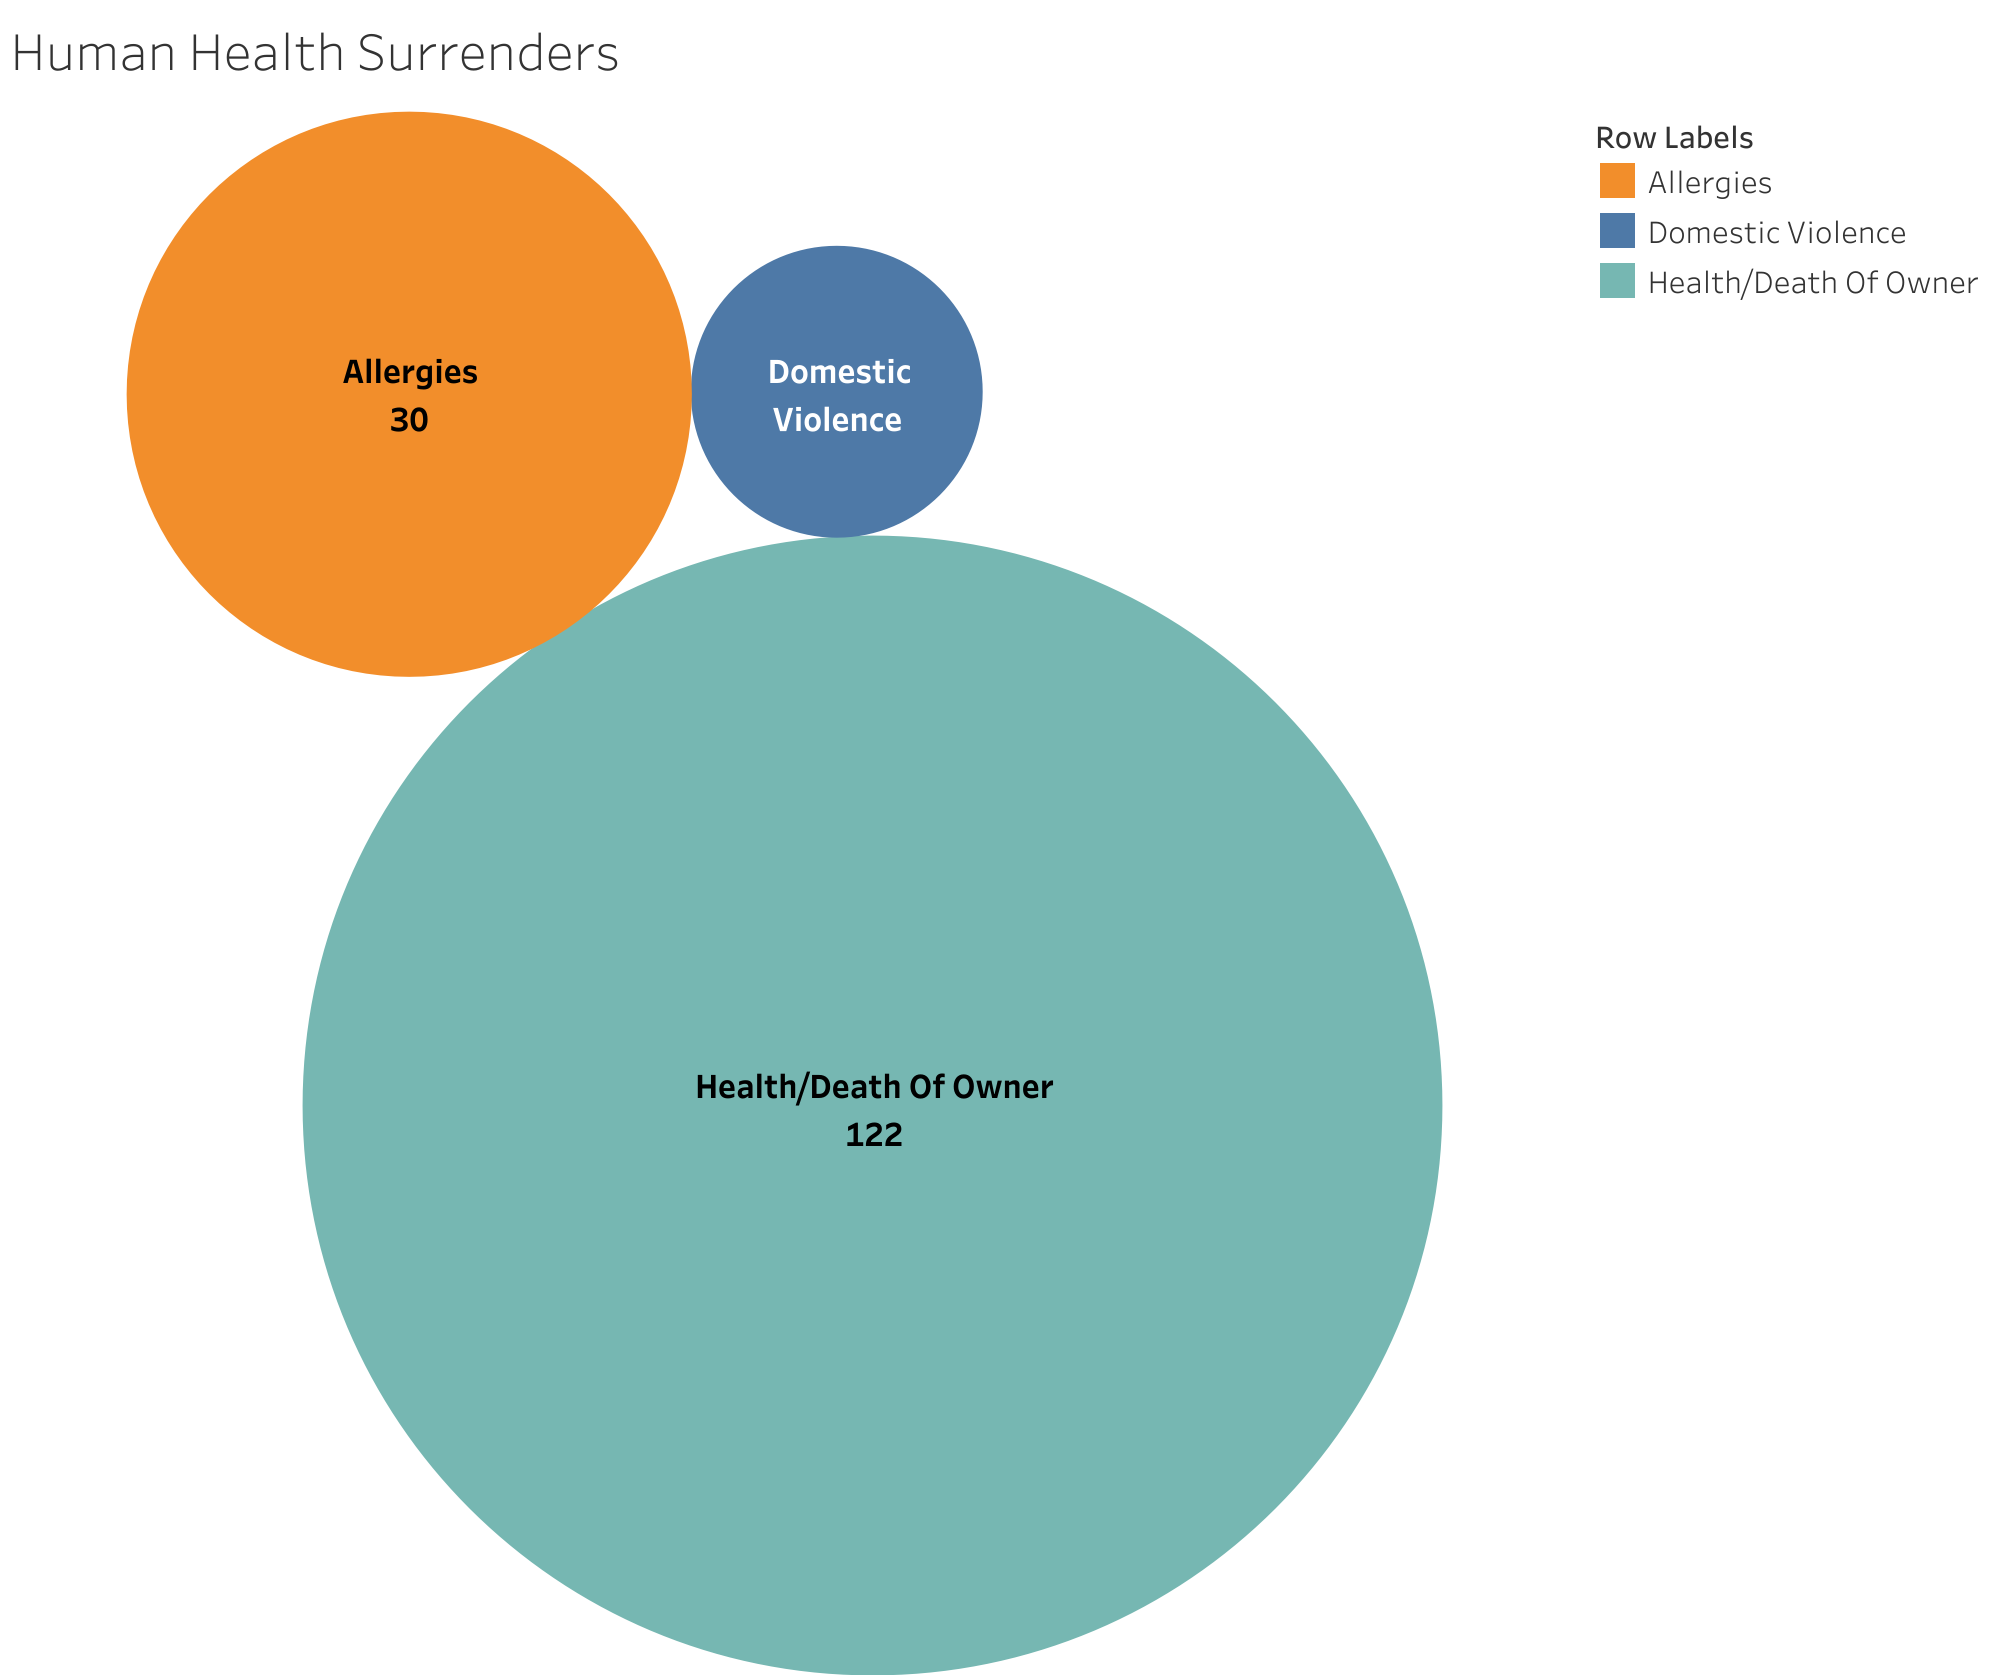
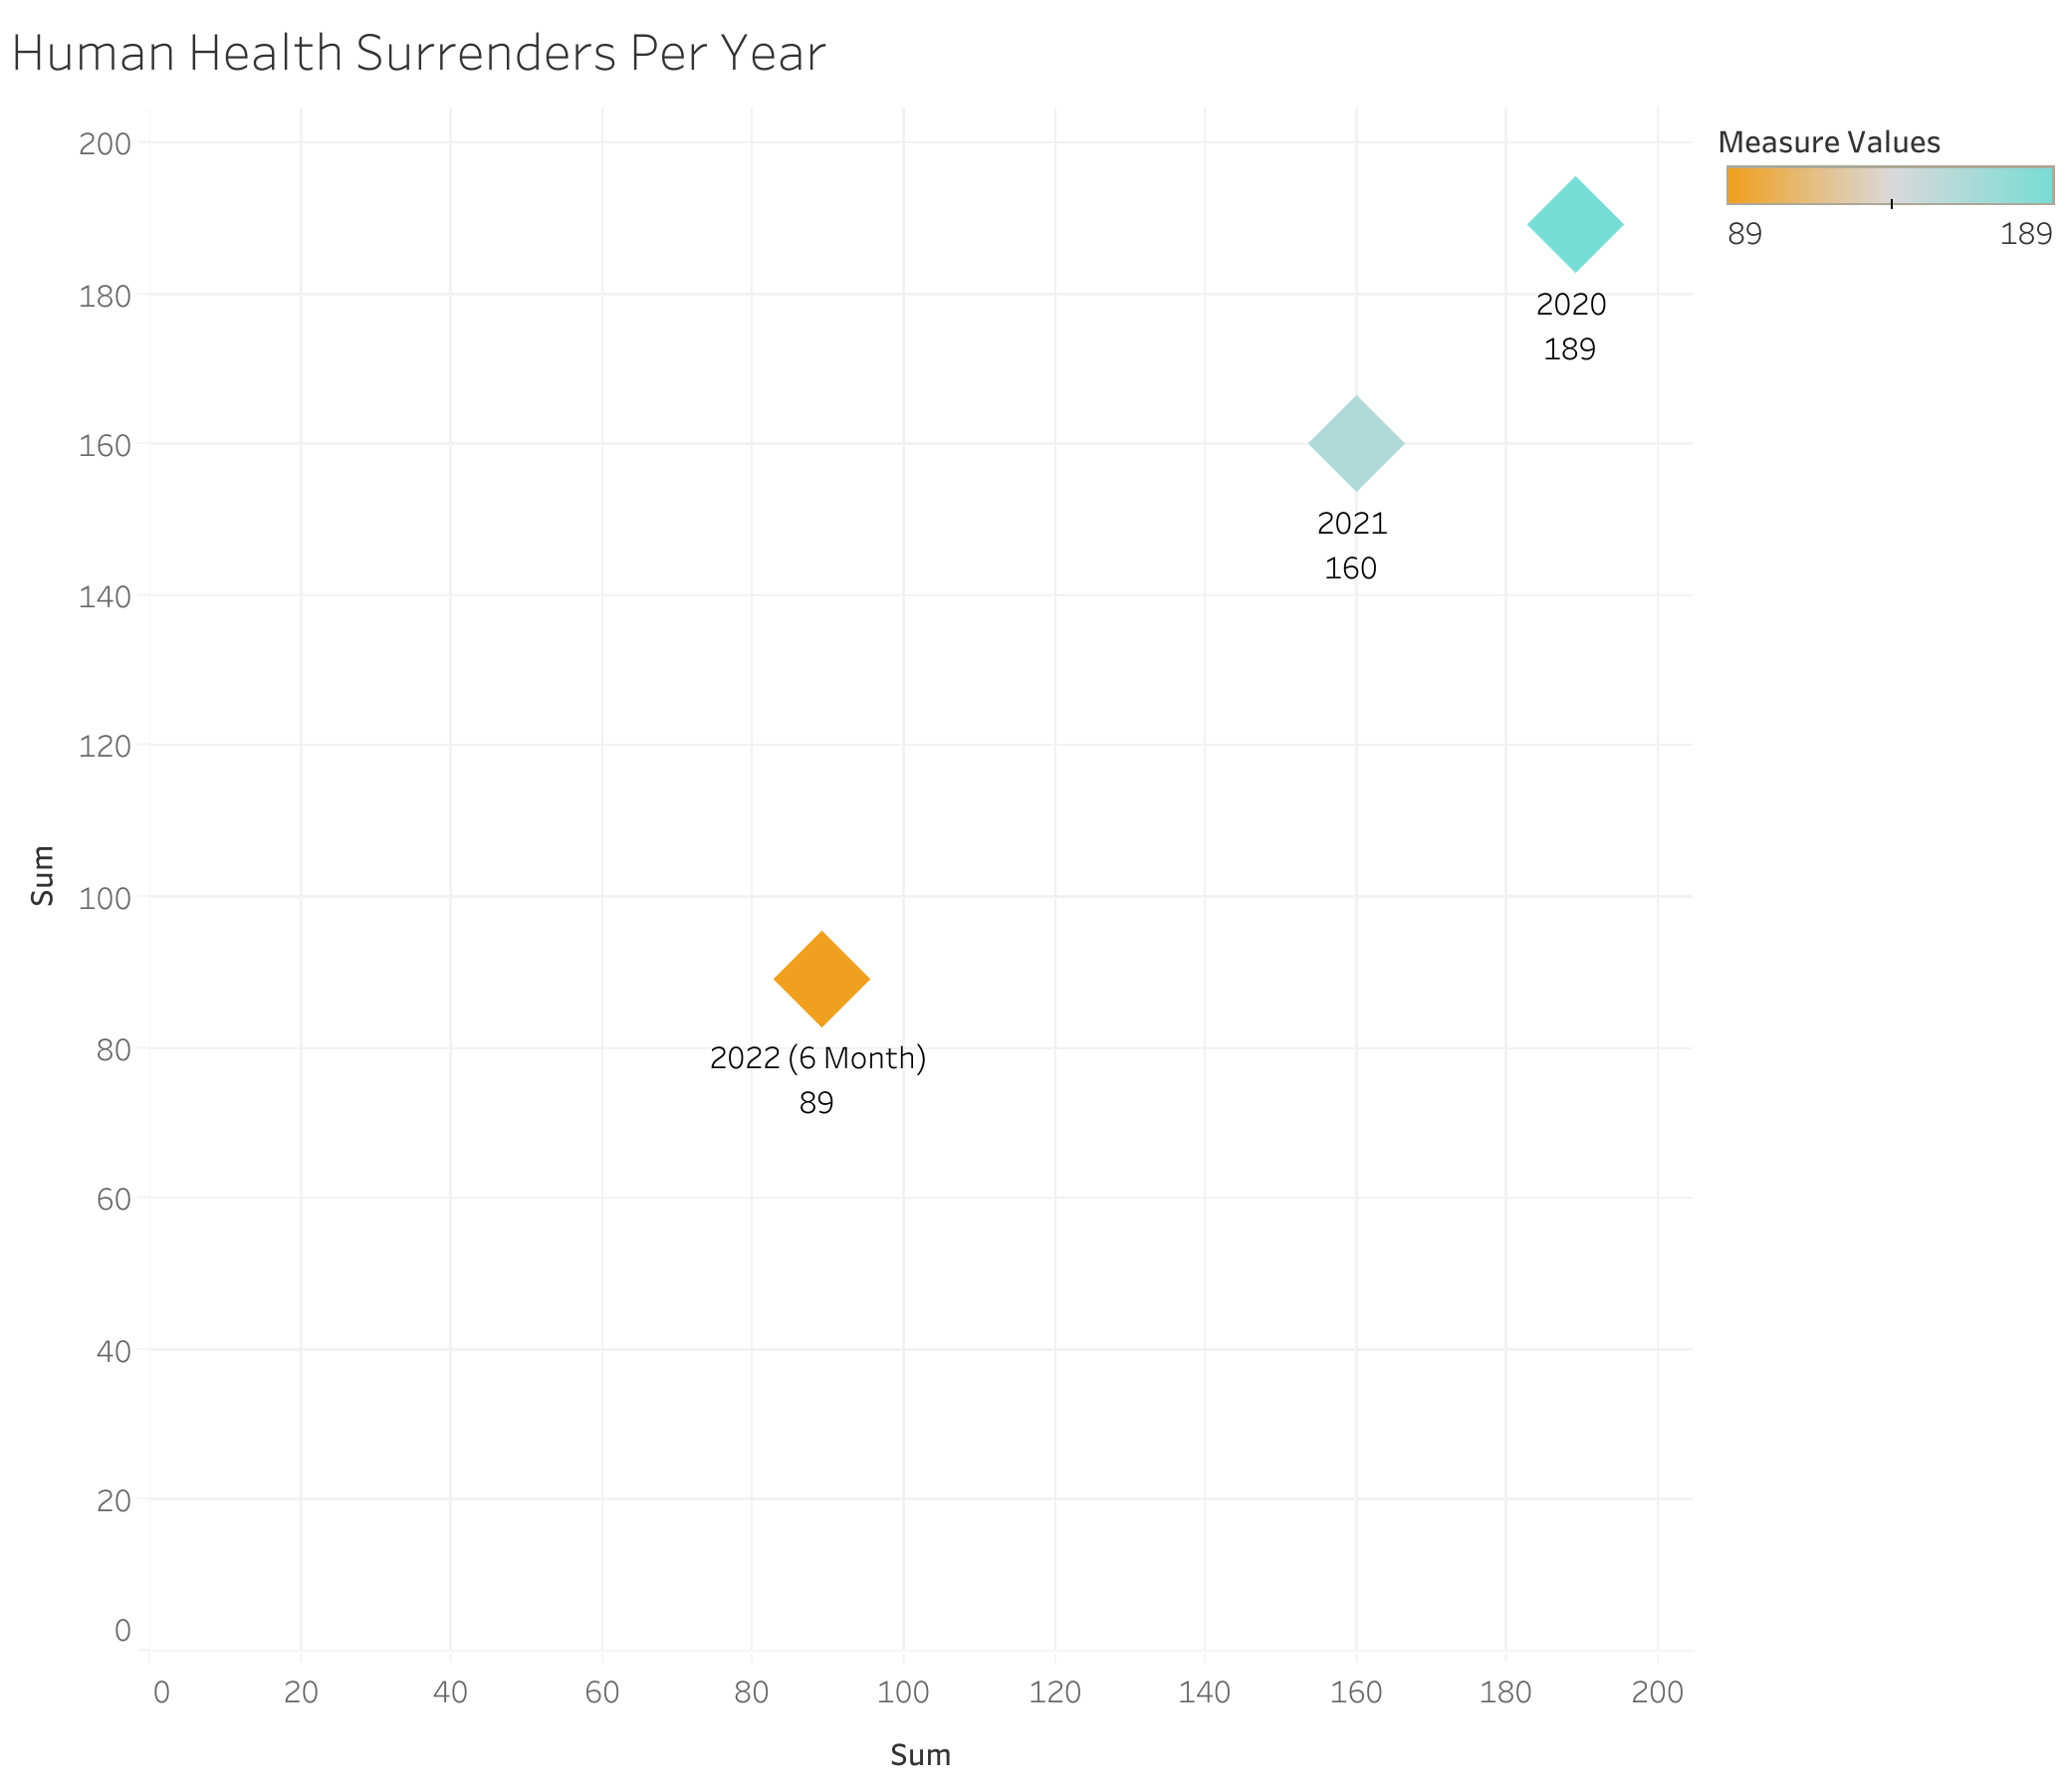
The amount of cats surrendered due to human health concerns, or the death of their guardian constituted 22% of our surrenders for the year - at 189. These, overall will be inevitable, but we hope to reduce the number of these surrenders by instituting animal will programs - helping people make plans for their animals when they pass, and more consulting and planning put into the adoption processes. "Please consider that the kitten you're adopting may live up to 25 more years - do you have a plan for it? Perhaps an older cat, or would you be interested in fostering instead?"
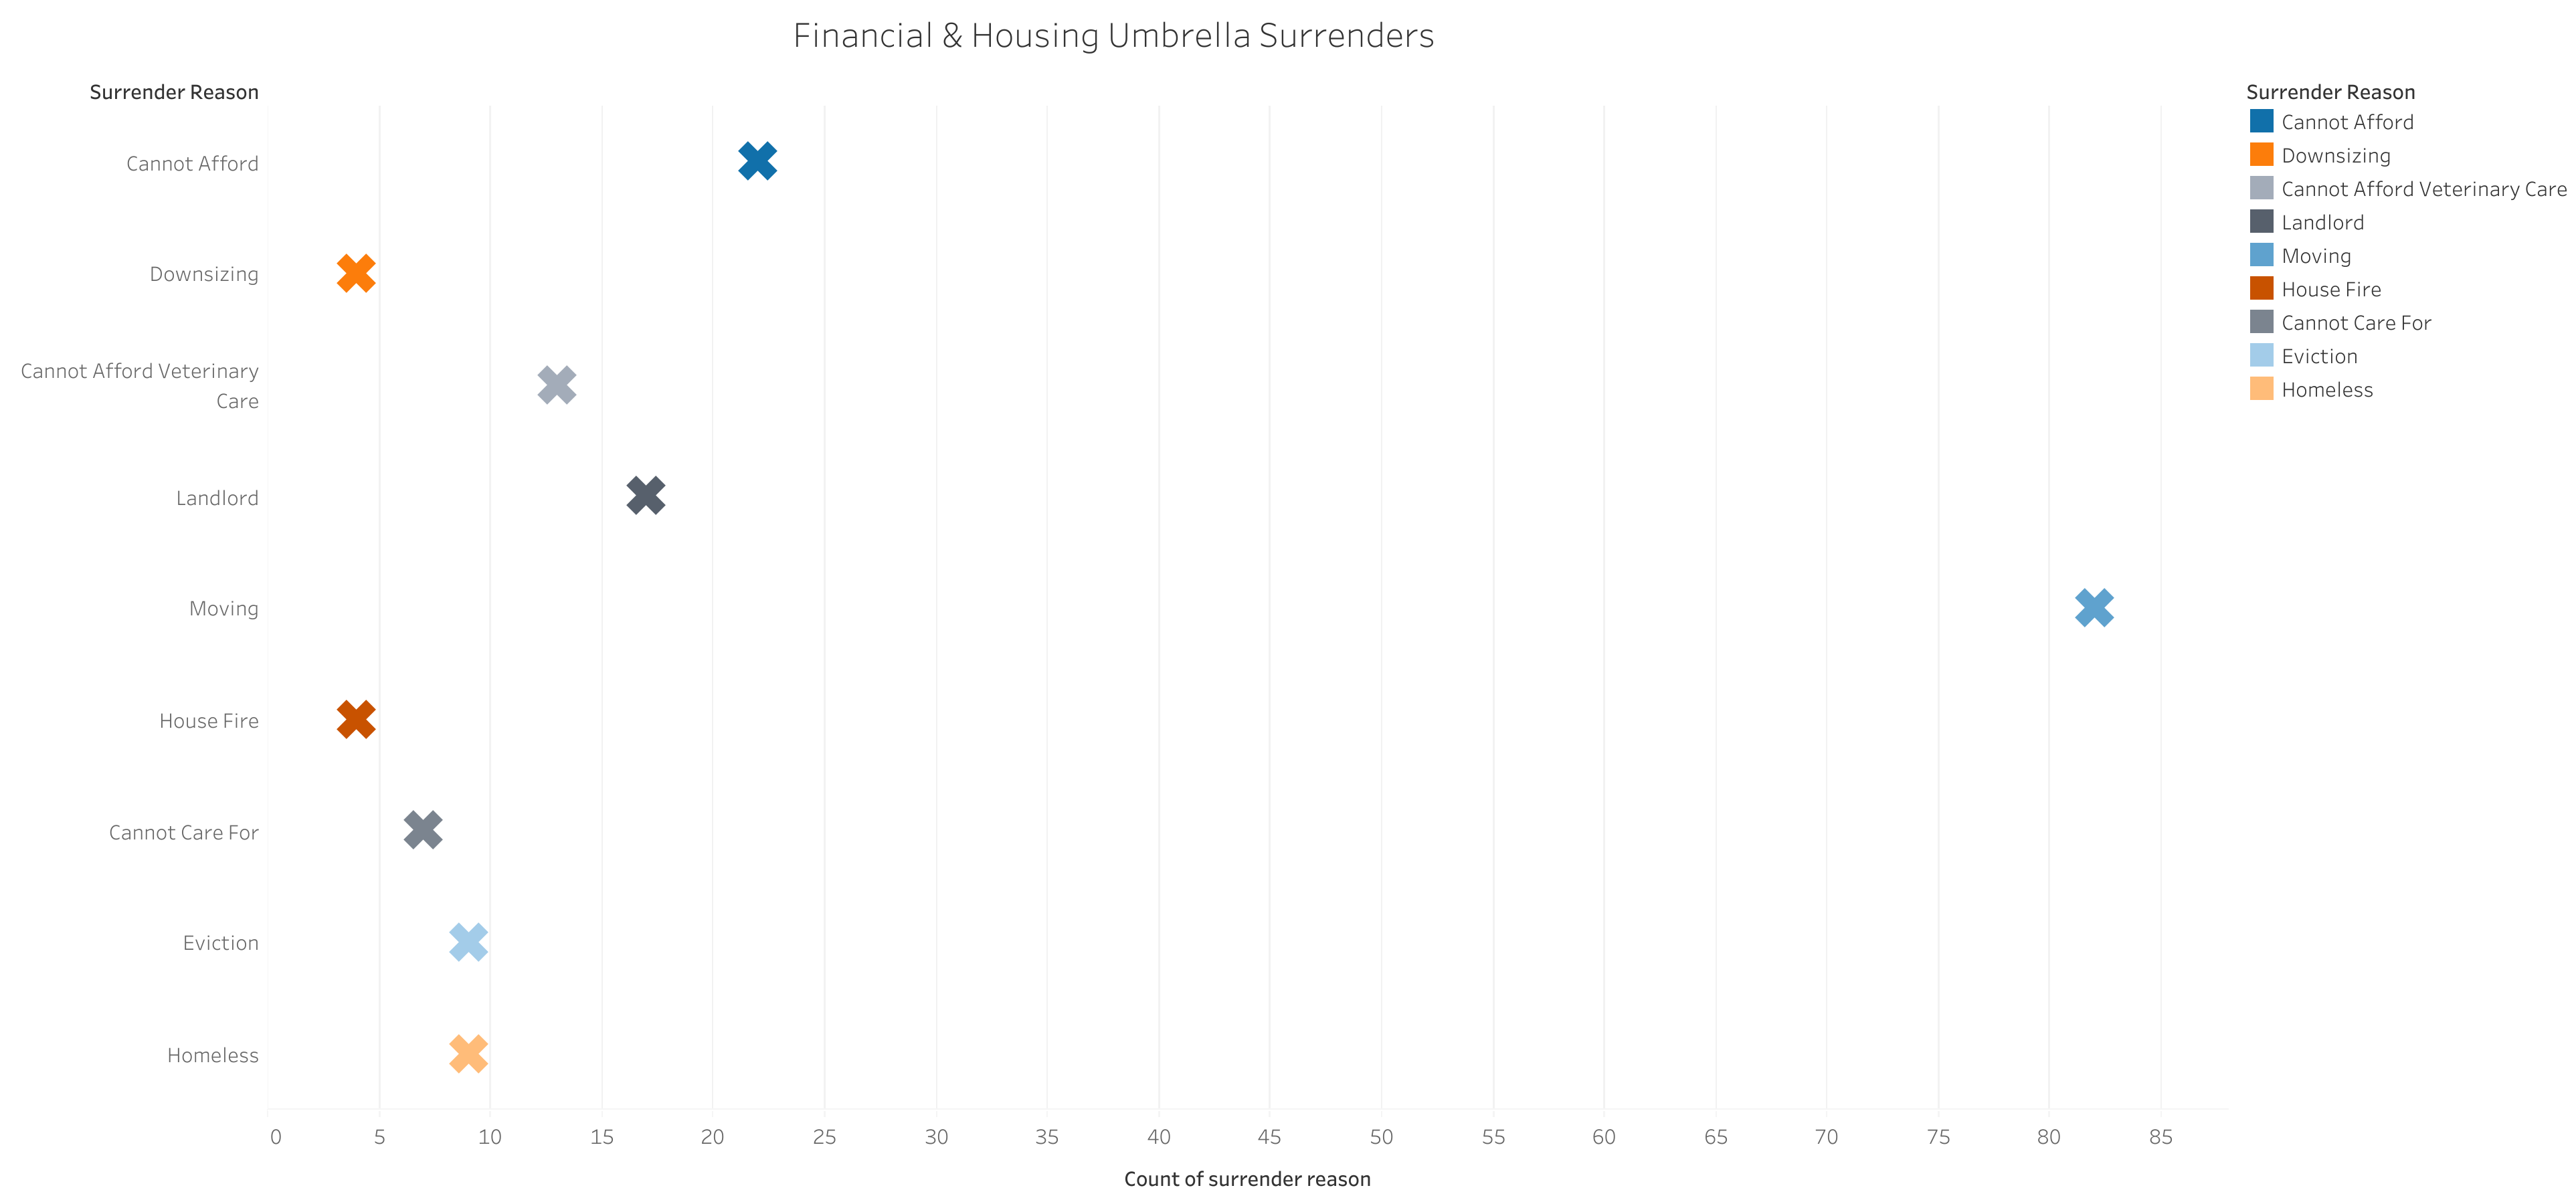
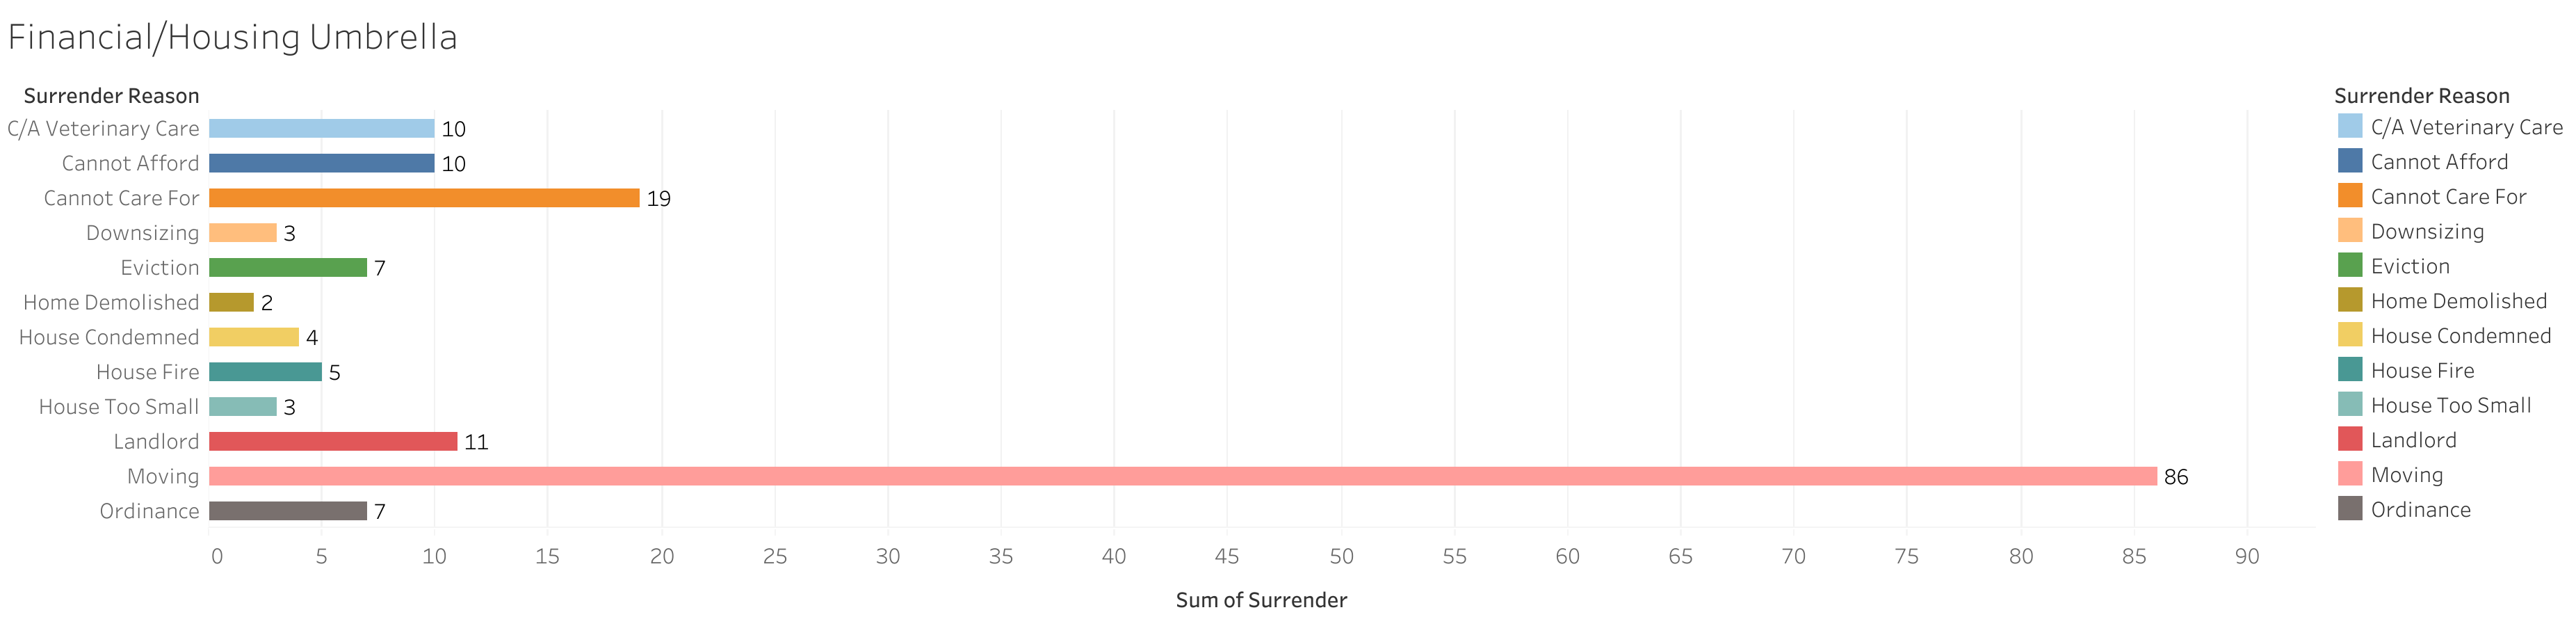
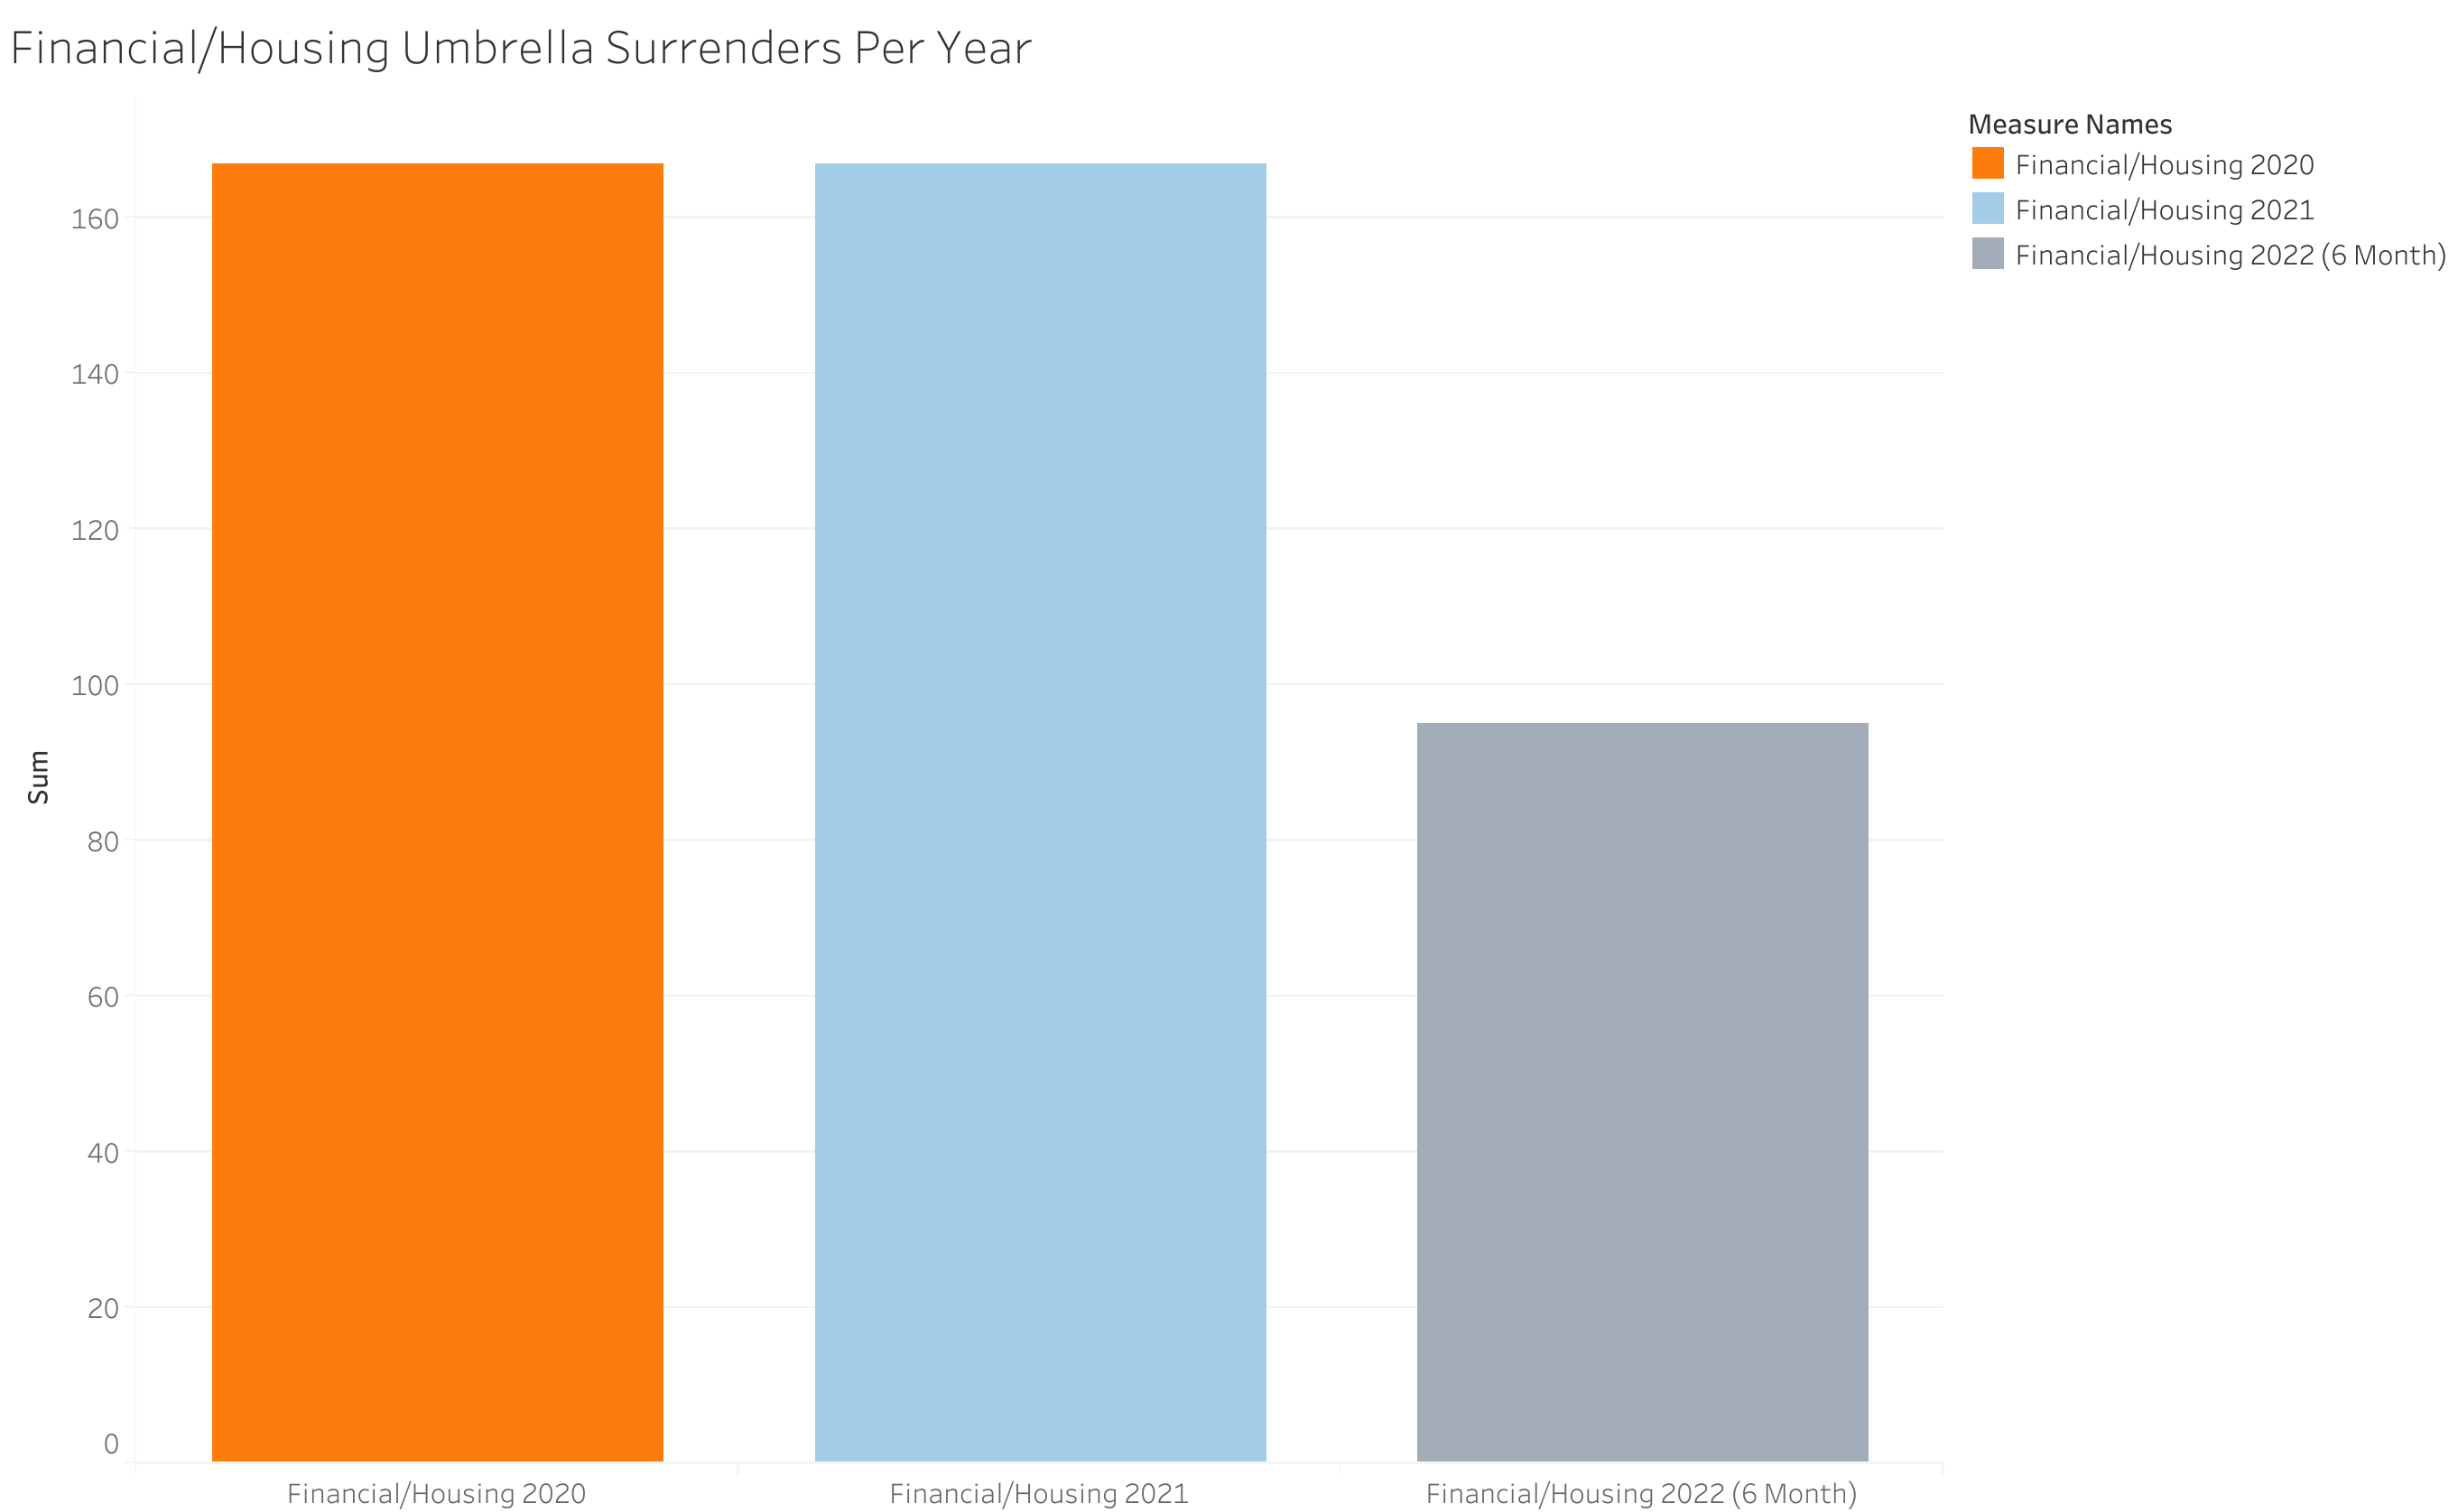
What I call the finance and housing umbrella, compiles all situations where a guardian was unable to afford the animal's care, and all situations where they were declined due to landlord limits or full restrictions, temporarily without a home due to emergency, and so forth. These constituted 19.5% of our surrenders at 167. These, again, will be inevitable to a certain extent, but we can help reduce them with emergency boarding programs, food and supply assistance, compiling lists of animal-friendly housing and keeping it handy for clientele, and working to urge property owners to be more open to animals. We have thought on how to have discussions regarding the reason for surrender, and how the shelter is a no judgement zone - the data helps us help our community and the animals - as a means to stop "Moving" from being a blanket reason.
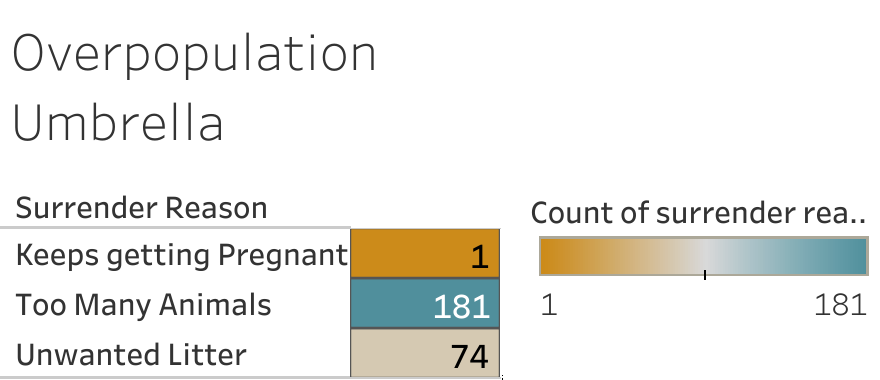
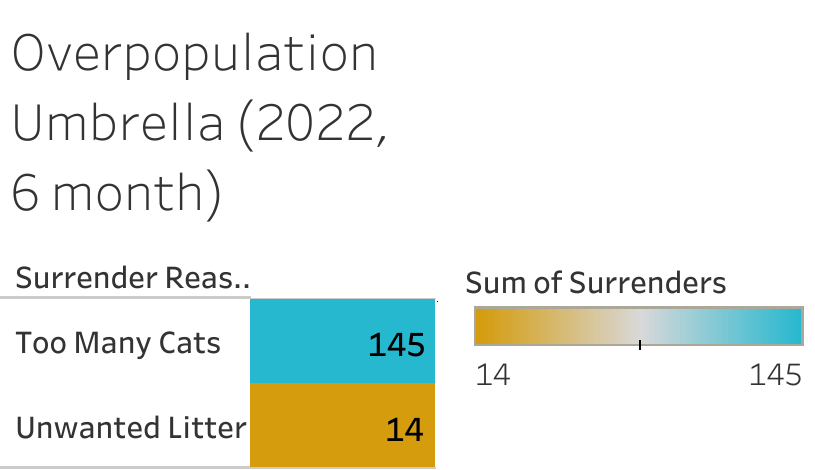
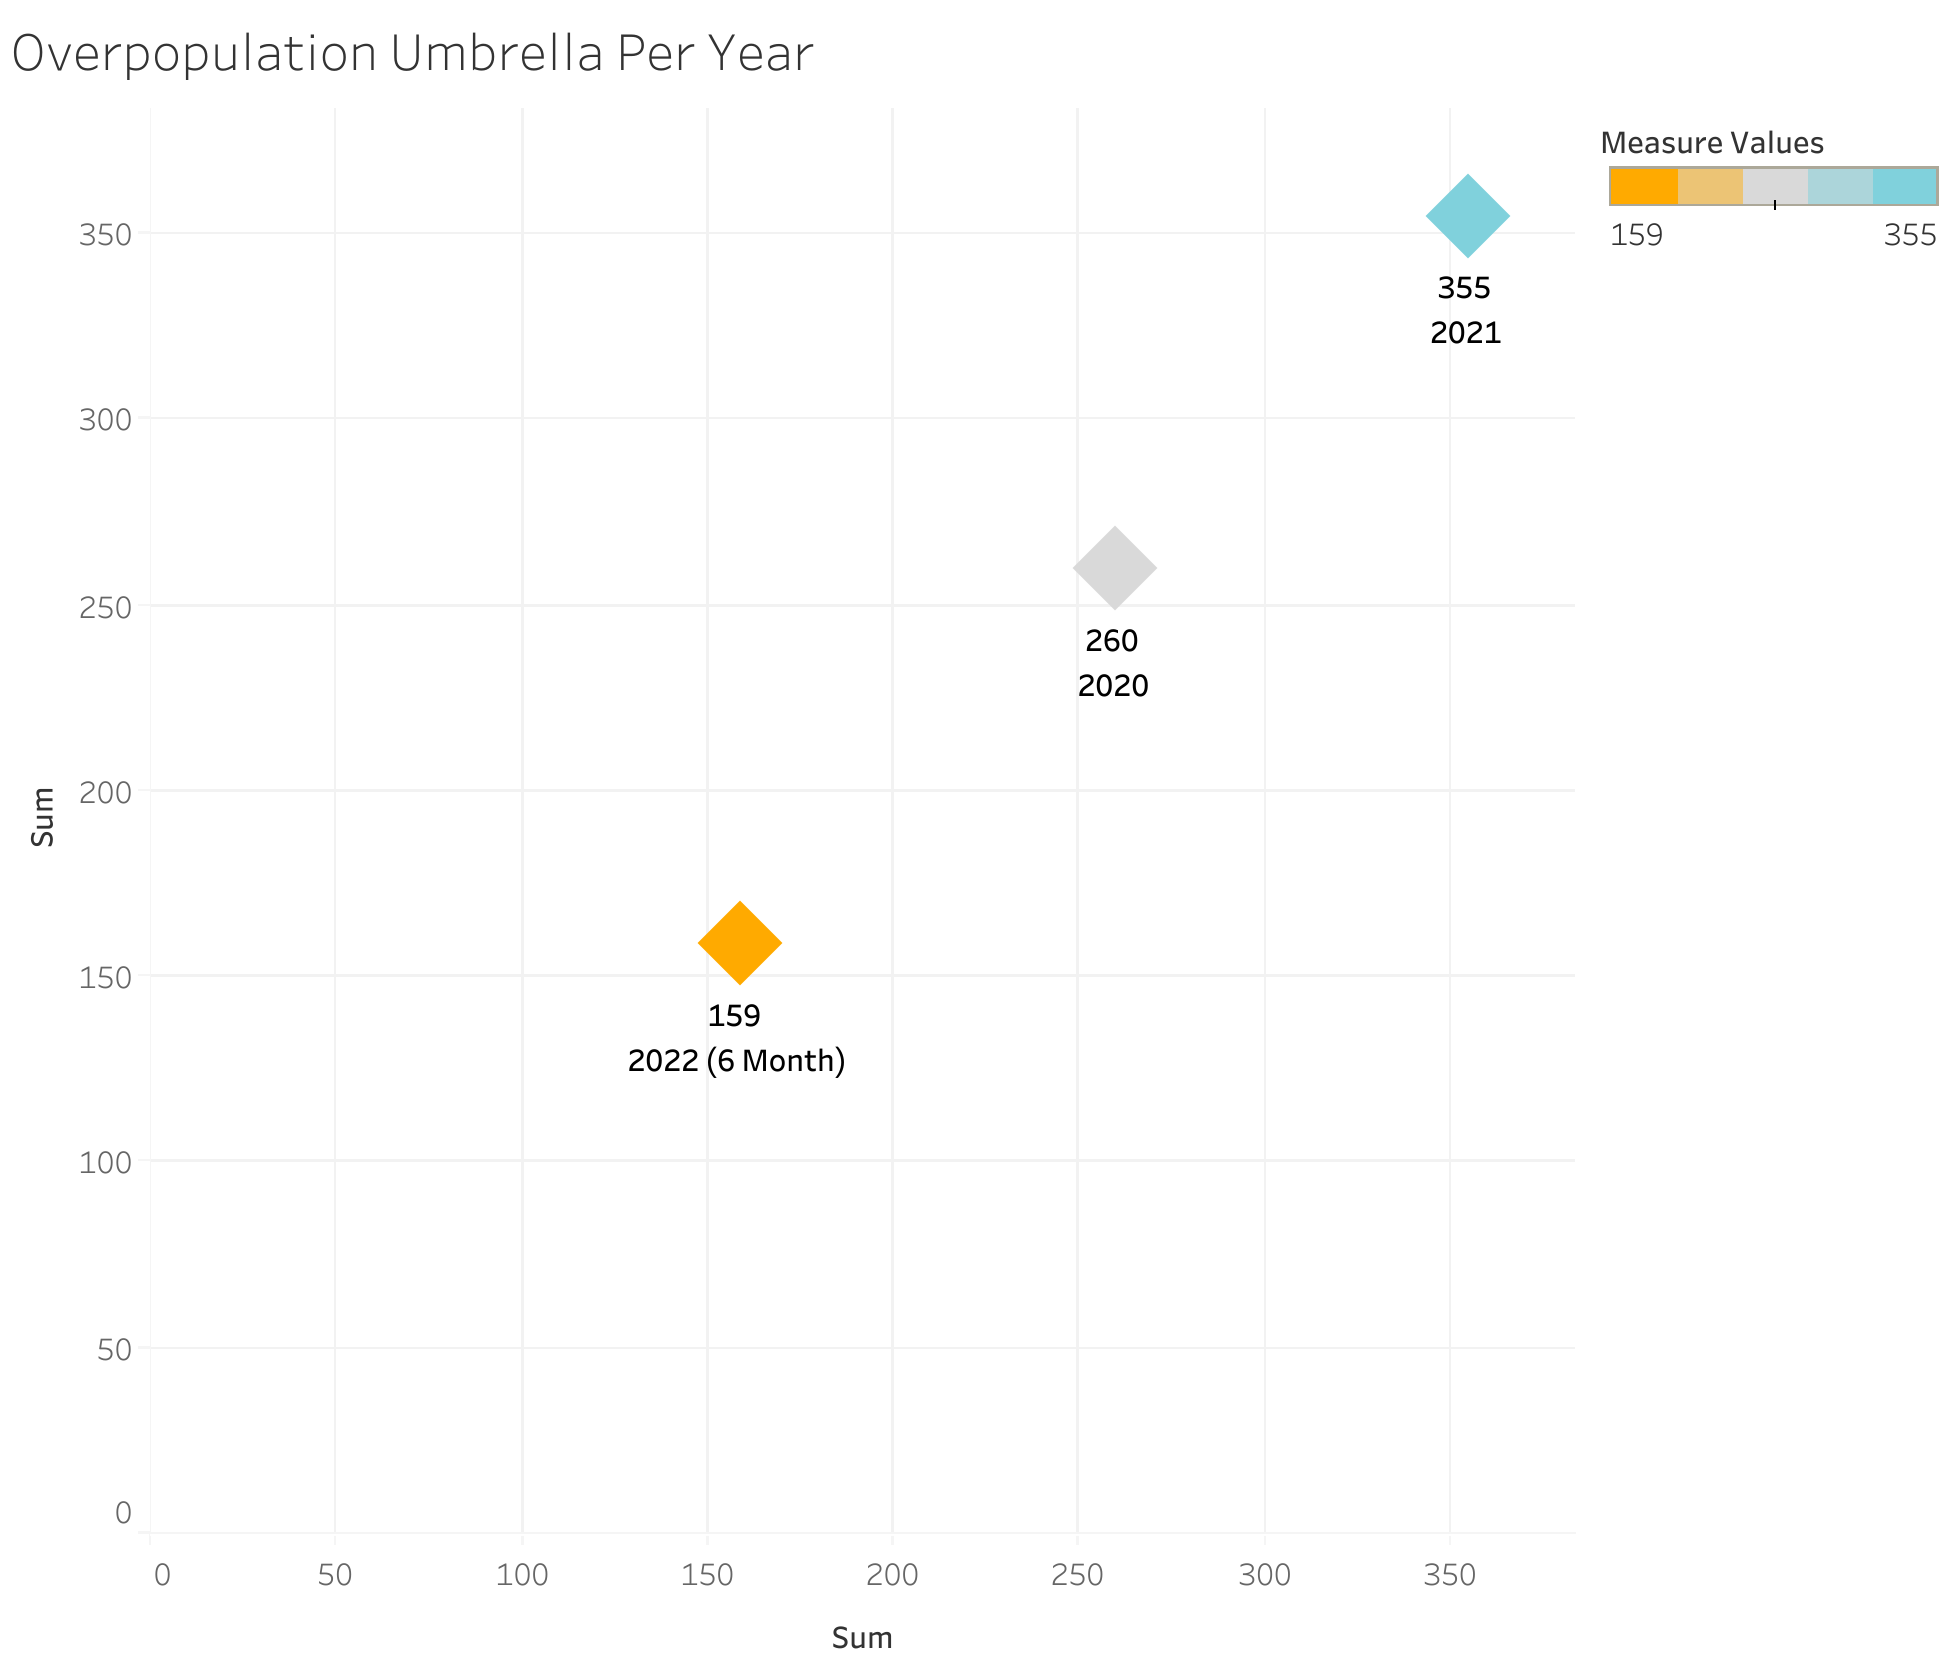
The overpopulation umbrella is by far our biggest community concern, at ~30% with 260 surrenders. This can be reduced by better spay and neuter programs, more accessible programs, and more community clinics overall. Better education for the public on why it's so important, and partnering with mental health organizations to assist in situations of compulsive animal hoarding.
13 could not have a reason deduced due to poor data entry.
2021
As you can see here, in 2021, our surrenders remained rather steady throughout the year this time, not following the trend of the prior year. A drop off in February, dips in April, October, and November, and a peak in June. Overall, though, there were fairly predictable numbers, leading to a total of 1012. This is a fairly large increase from the prior year.
For this year, behavior surrenders constituted 16.69% at 169. This is a stark increase to the previous year, but seems reasonable considering the increase in surrenders overall. Out of these, 13% (22) were consulted, 2% (4) refused according to available notes, making a total of 15% offered.
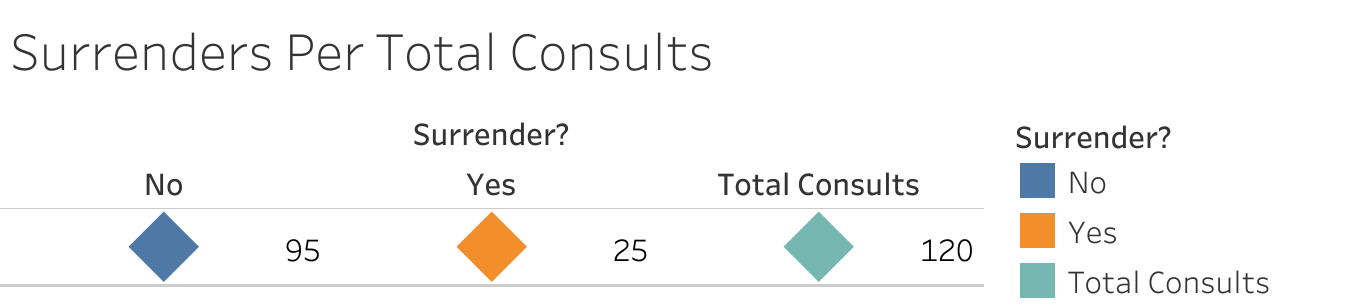
I consulted a total of 120 clients this year, 95 of those kept their cats - the other 25 surrendered. These numbers appear off as only 25 behavior surrenders were consulted as you see in the last pie chart, but for a few of these I was not consulting for behavior but rather general cat questions and care. These must be reflected in my consults, but don't coincide exactly with behavior surrender information. It is not an anomaly.
The retention rate for this year would be 19/24. (5 out of every 24 clients consulted surrender their cat.) The program remains very effective. Using the same speculatory projections as before, if offered 100% of the time, we may have been able to prevent 120 additional cats from entering the shelter system.
Veterinary surrenders made up 2.7% of all this year, which is fairly consistent with the previous year.
I did not create a viz for this, but, a unique thing about 2021 is that we had enough issues with a new group of surrenders to develop a new "Umbrella" - mental health/law associated surrenders. This includes animal abandonment (more often than not, the associated investigation/notes corroborated mental health and/or legal issues being the cause), animal cruelty, domestic violence and fear for animal's safety due to other individuals, incarceration, reporting of mental health by the guardian, and animal neglect.
These made up 6.22% of all surrenders at 63 total. This could be prevented with better educational tools for animal care, truly marketing the shelter as a no-judgement zone where you are free to bring your animal - perhaps lowering fees, more relationships and resources for mental health and domestic violence resources, and perhaps, depending on the reason for and duration of incarceration - additional boarding programs.
There were again excluded "silly" surrenders that made up 6% of surrenders. Not worth documenting due to lack of useful information.
There was a decrease in human health/death surrenders this year, only 15.81% (160). As the label is missing and I did not realize to add it - the total DV cases were 8.
The financial/housing umbrella made up 16.5% (167) this year, this is the same amount as the previous year, making up a lower percentage.
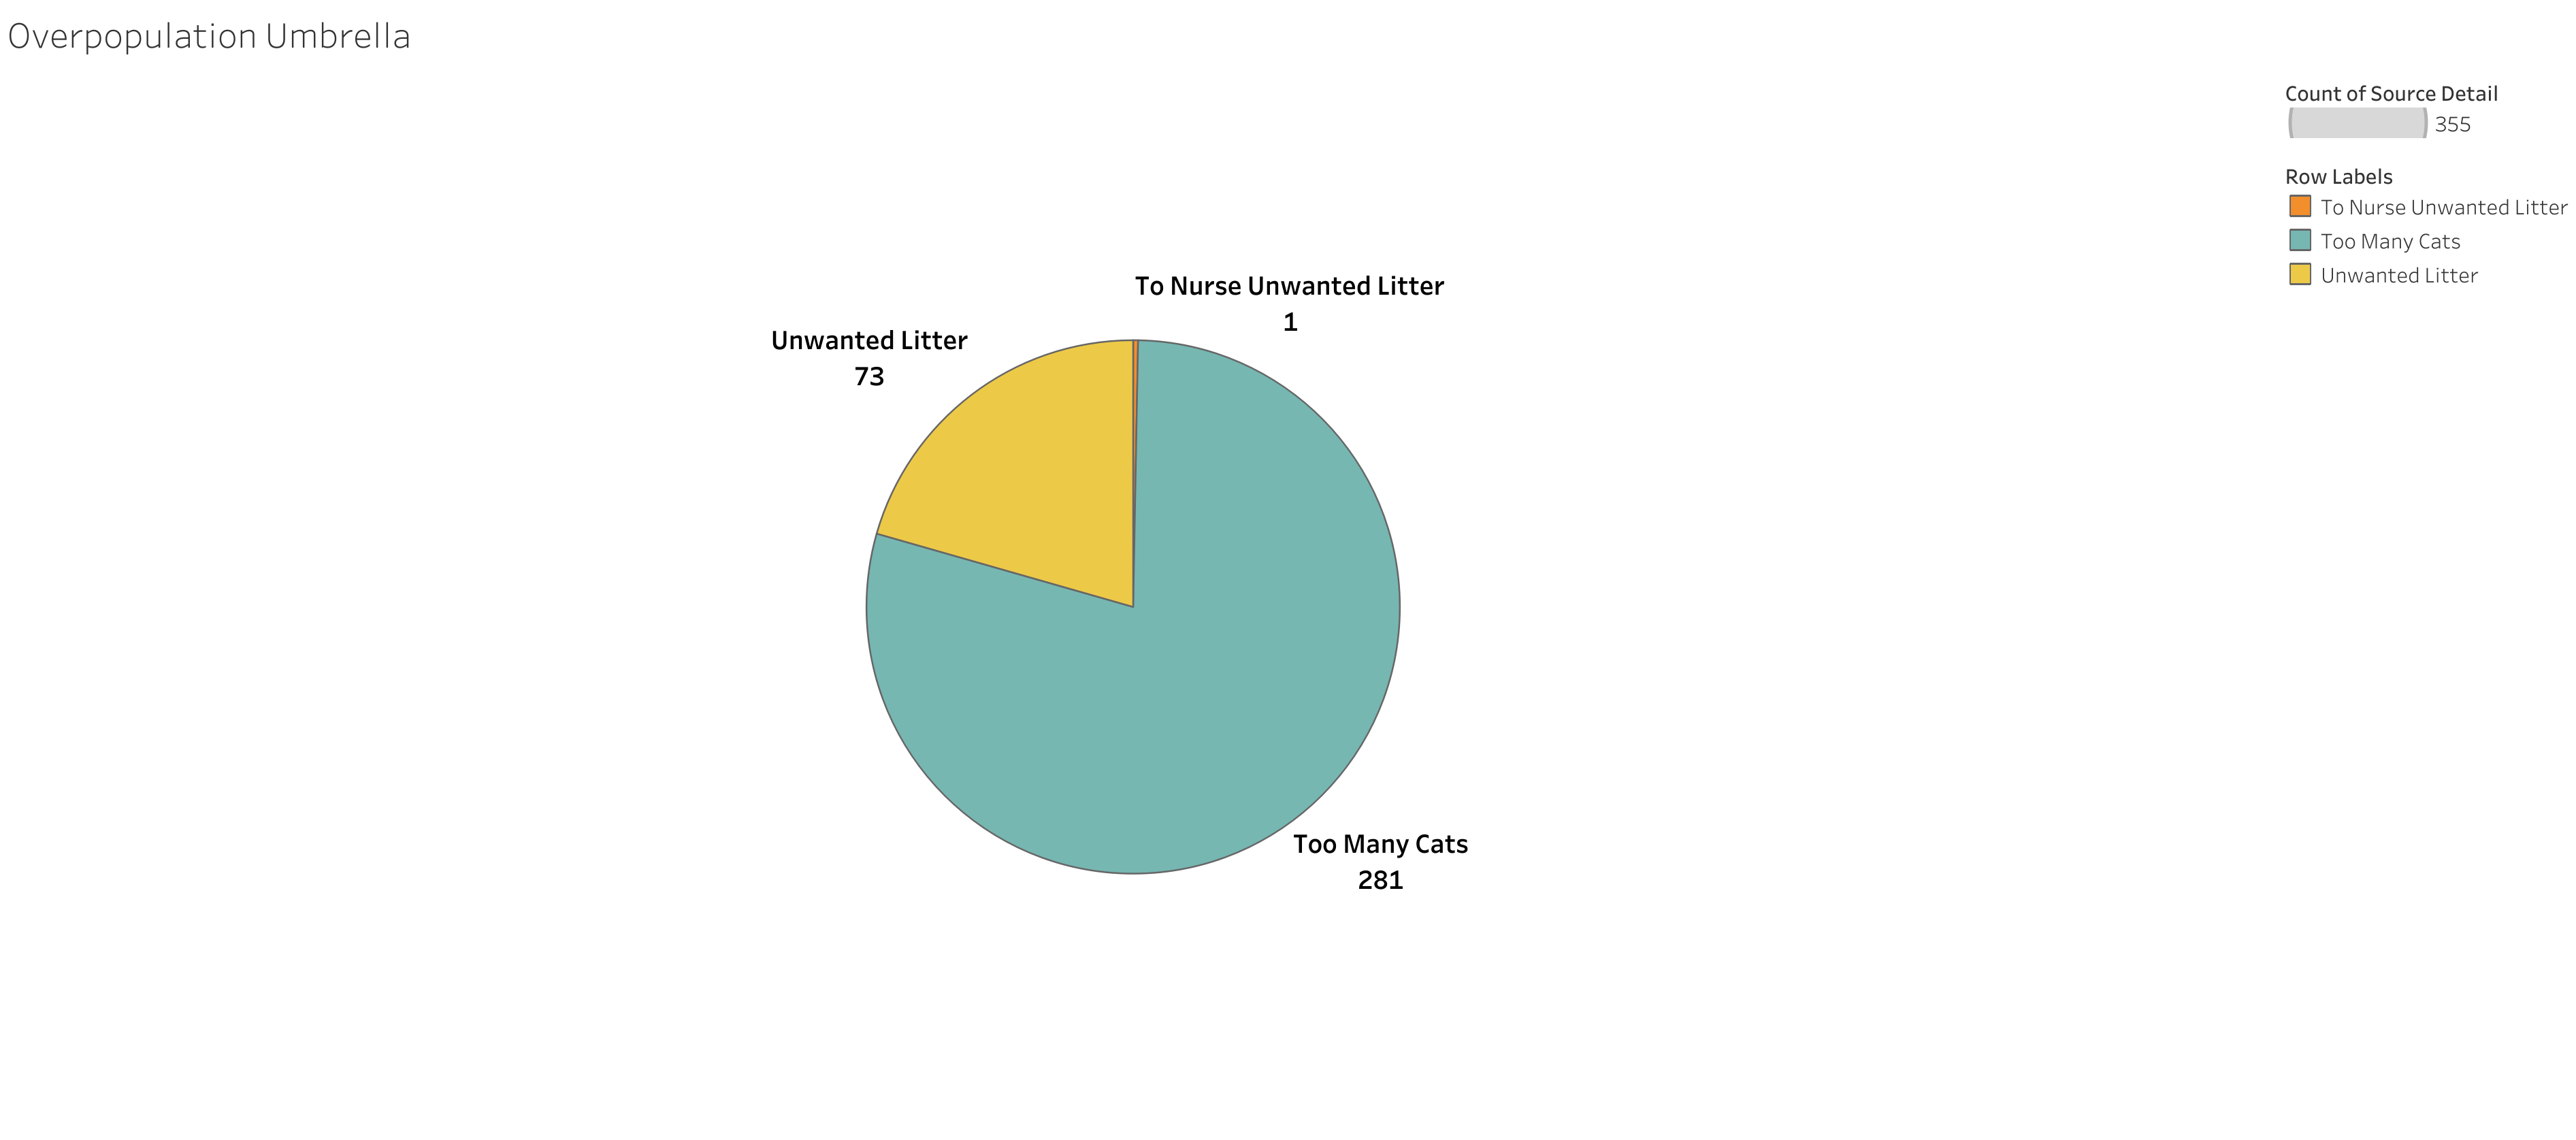
The overpopulation umbrella made up 35% (355) this year. This is just a bit over a proportionate increase considering the higher overall surrenders this year. This remains our community's biggest issue in need of assistance.
27 could not have a reason deduced due to poor data entry, more than double that of the previous year.
2022 (First Half)
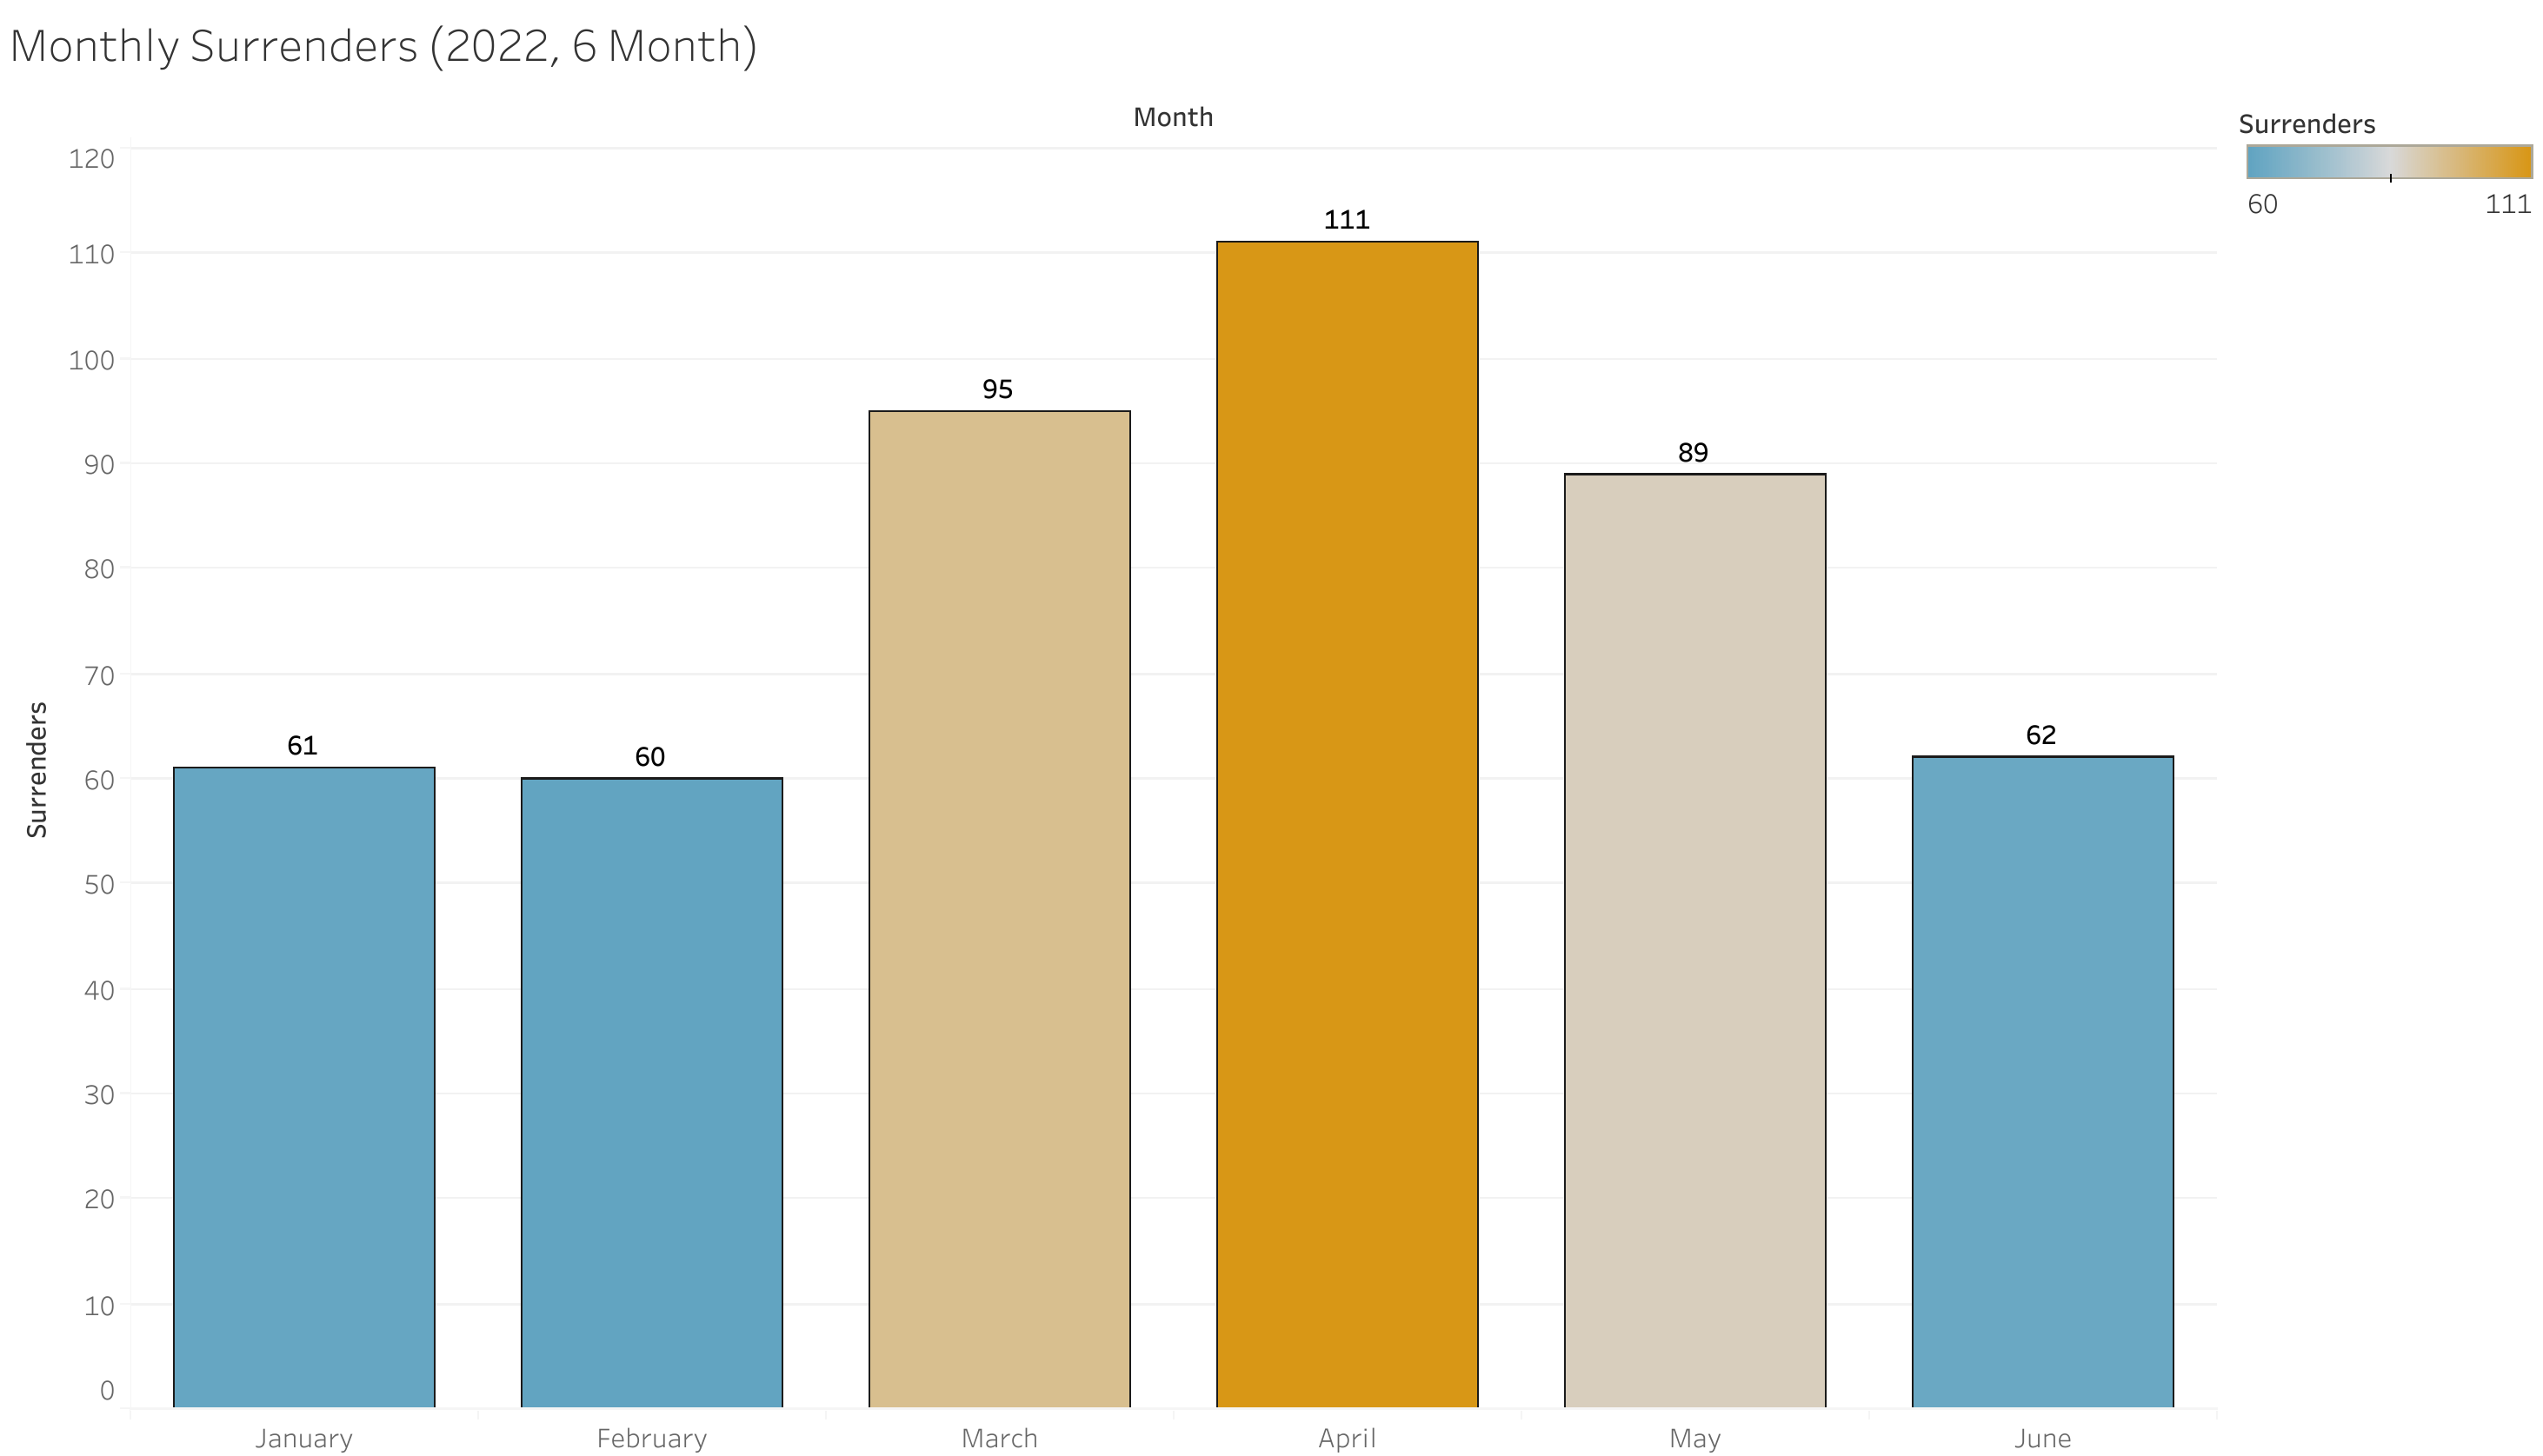
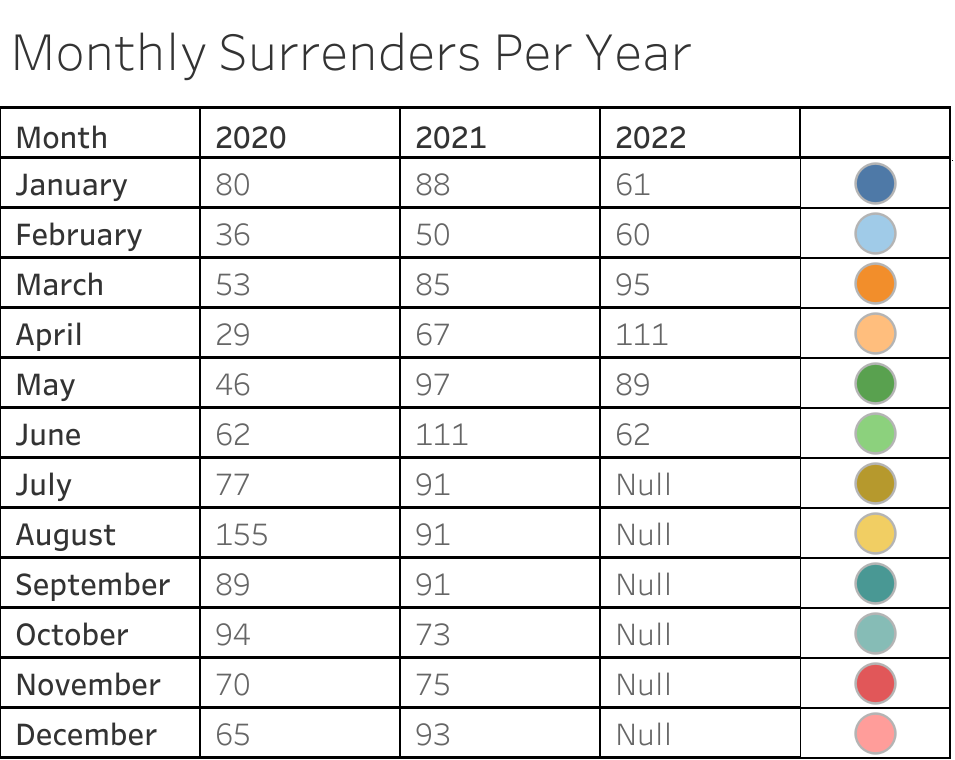
It does not appear that there is any form of pattern throughout the years regarding highest months. February has remained the lowest-intake month, but beyond this there is no particularly valuable information.
So far this year April has been the month of highest intake. I do hope to continue analyzing this data as knowing this industry, trends here could be rather interesting. For instance, one could speculate higher surrenders in June and July are due to moves considering the end of the school year. If January were the highest we may deduce a bit of "buyers remorse." Spring, we may think "Unwanted Litters" due to it being the beginning of kitten season. There are a lot of factors that can go into time of year - but since we're not seeing any trends so far, there isn't anything to go on.
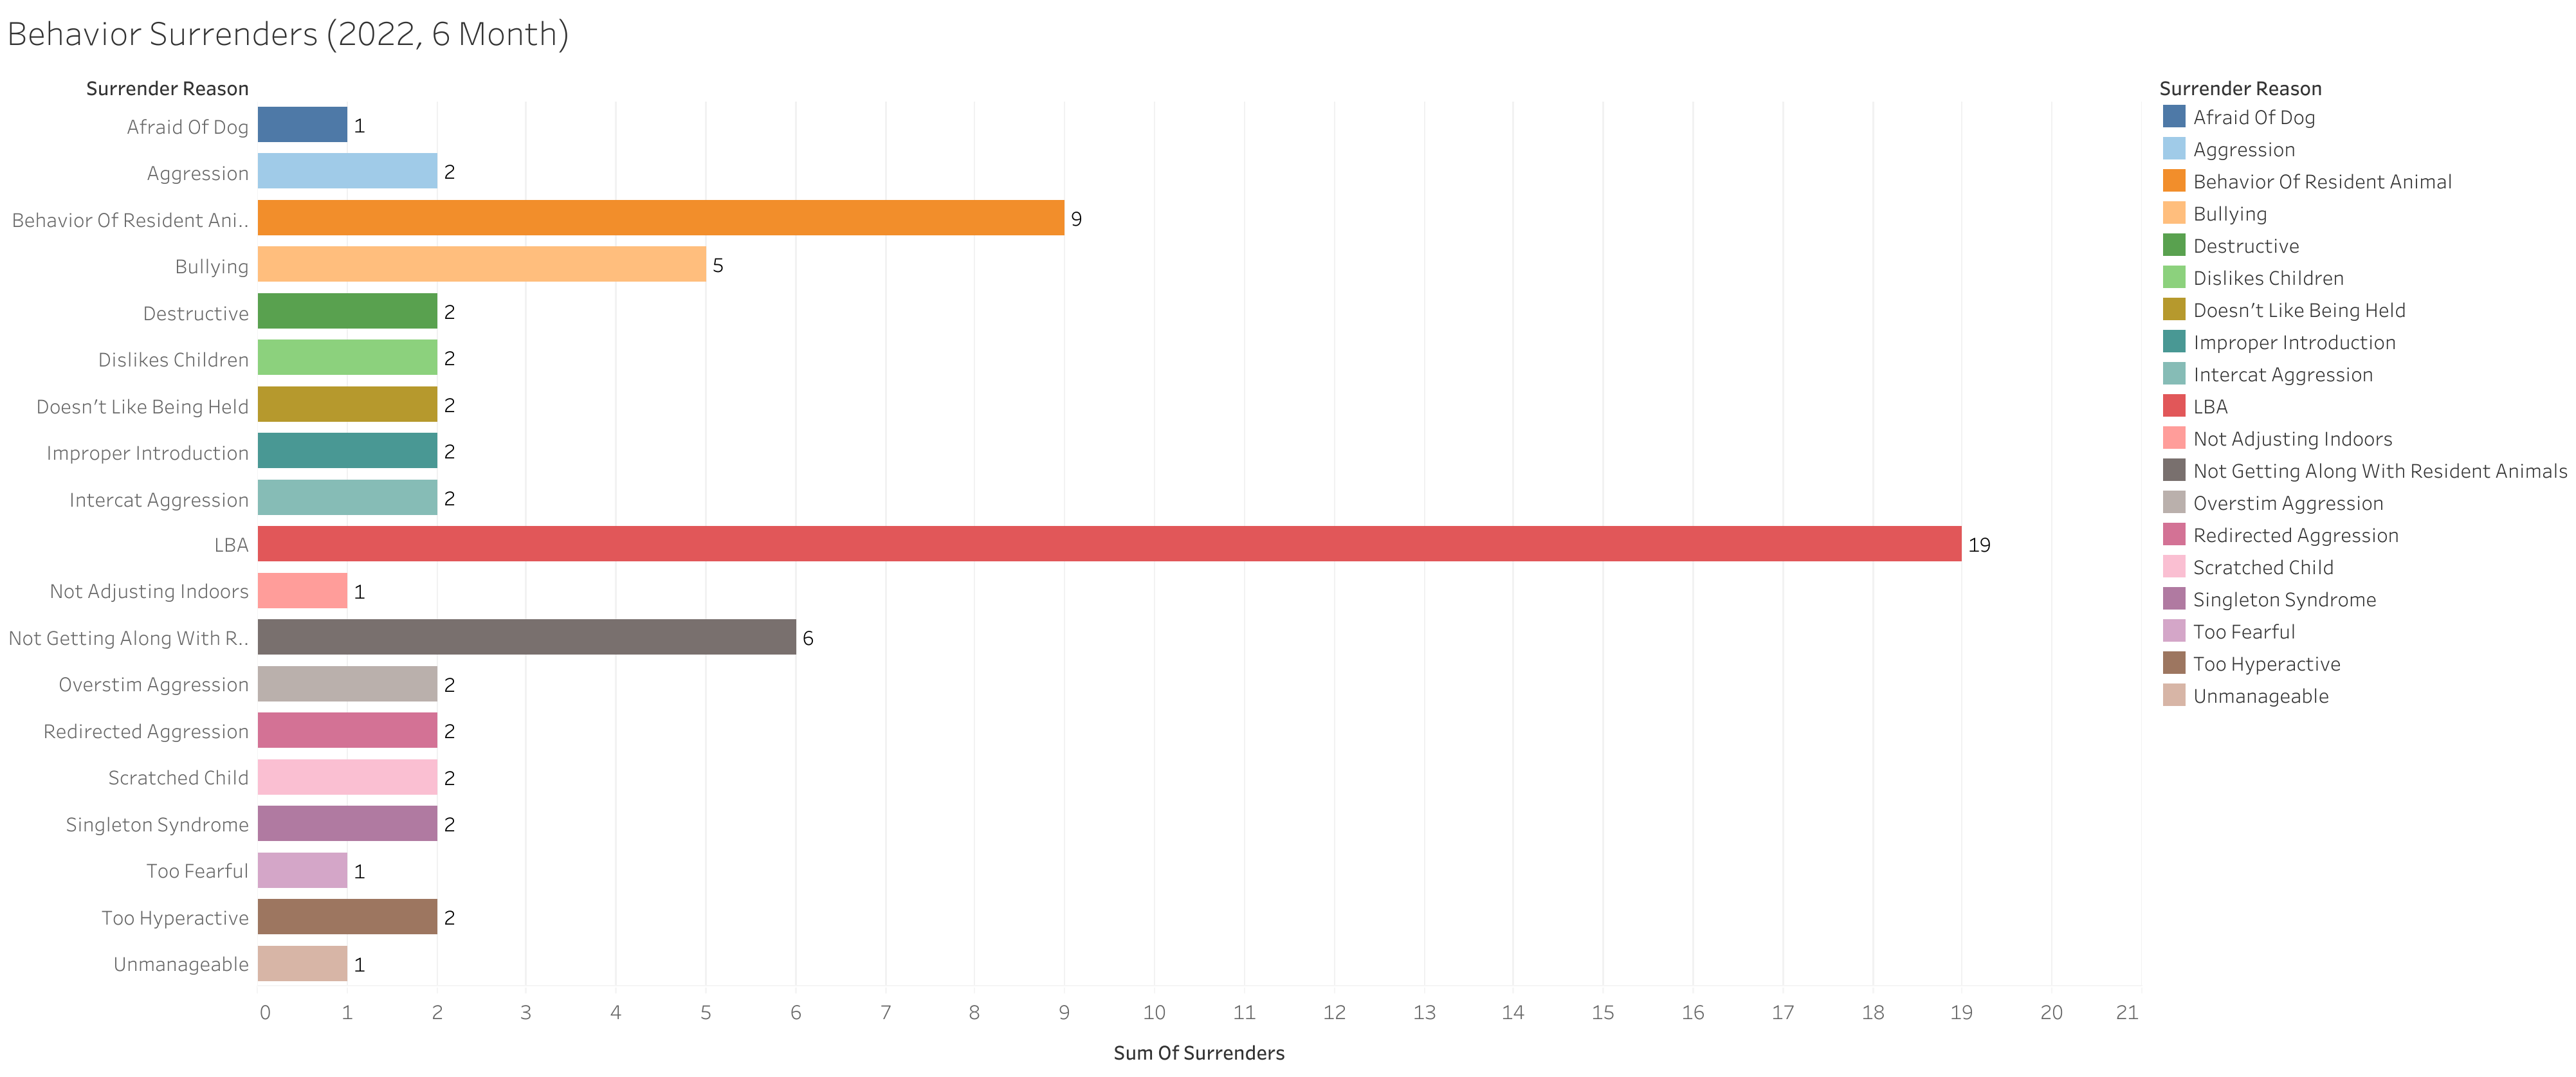
Litter box avoidance has steadily remained the highest behavioral surrender reason reported - and seems consistently followed up by issues with other animals in the home.
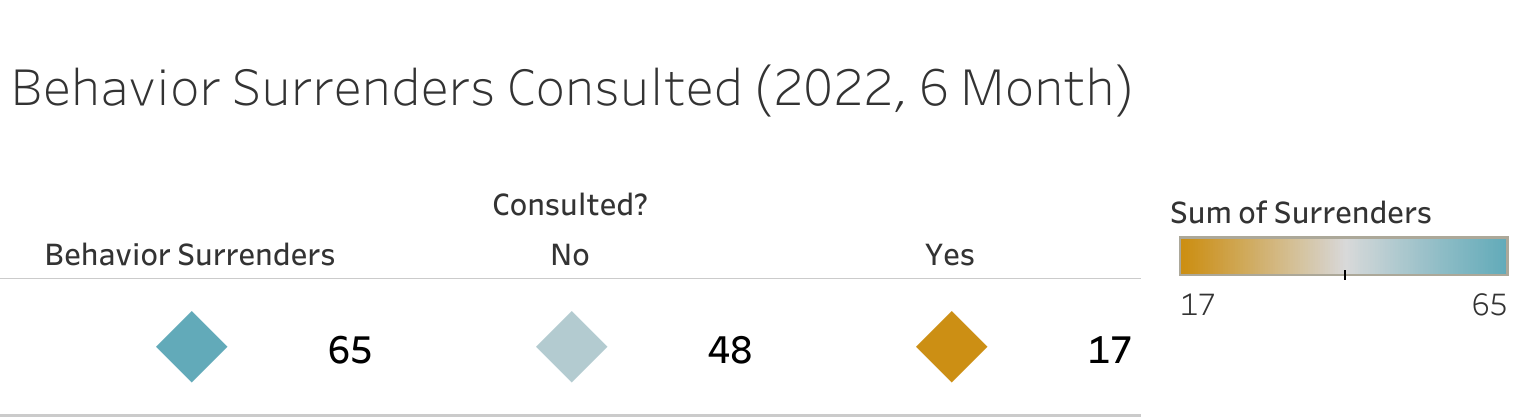
Behavior surrenders as a whole made up 13.60% of all surrenders at 65. Out of our 65 behavior surrenders, 17 were consulted and 18 were not. So far I have not come across any data regarding offers/refusal - so with that, 26.15% recieved consult.
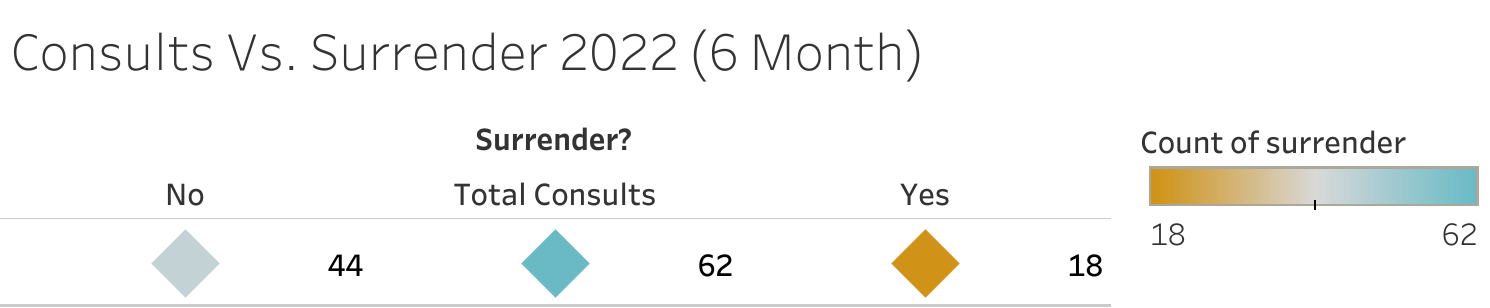
So far this year I have consulted 62 clients, of which 18 have surrendered and 44 were retained. This gives me a retention rate of 22/31, meaning 9 out of every 31 clients consulted surrender their cat. Using the same projection I've performed in previous years, at this point it says we would have been able to prevent 41 of these cats from coming in.
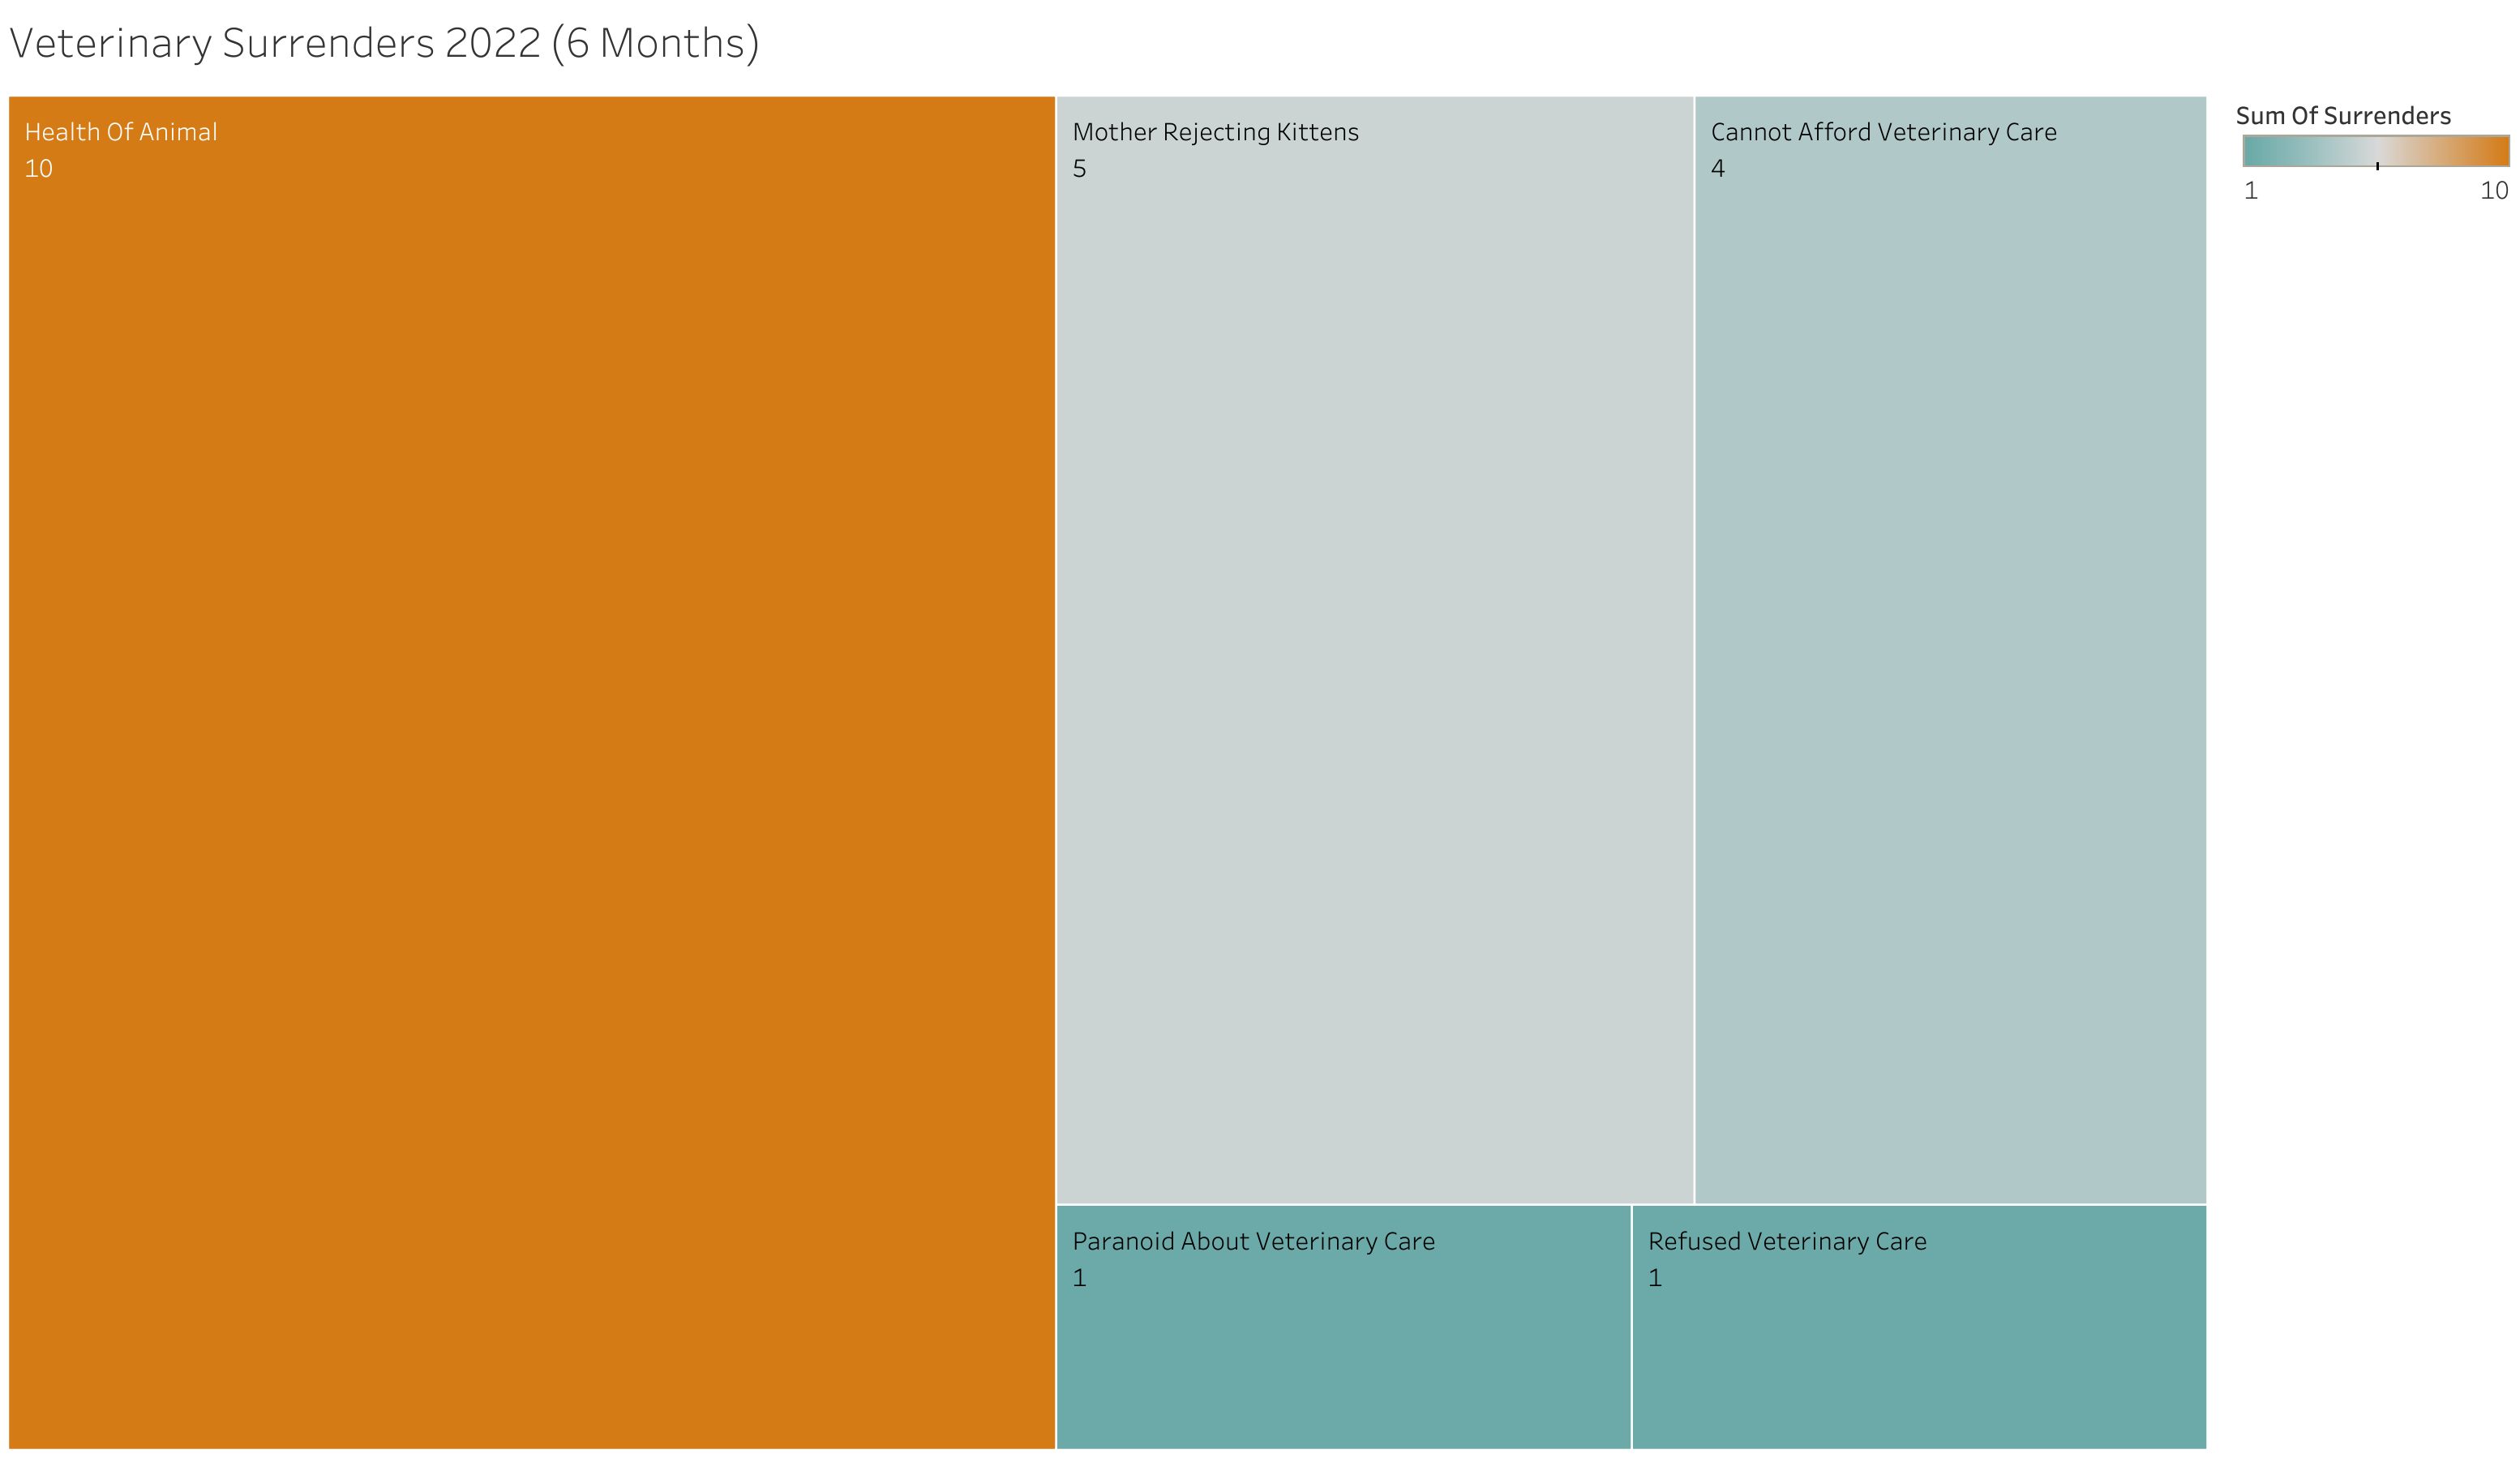
Veterinary surrenders made up 4.3% (21) of all this year.
Mental health surrenders have made up a whopping 6.9% this year at 33.
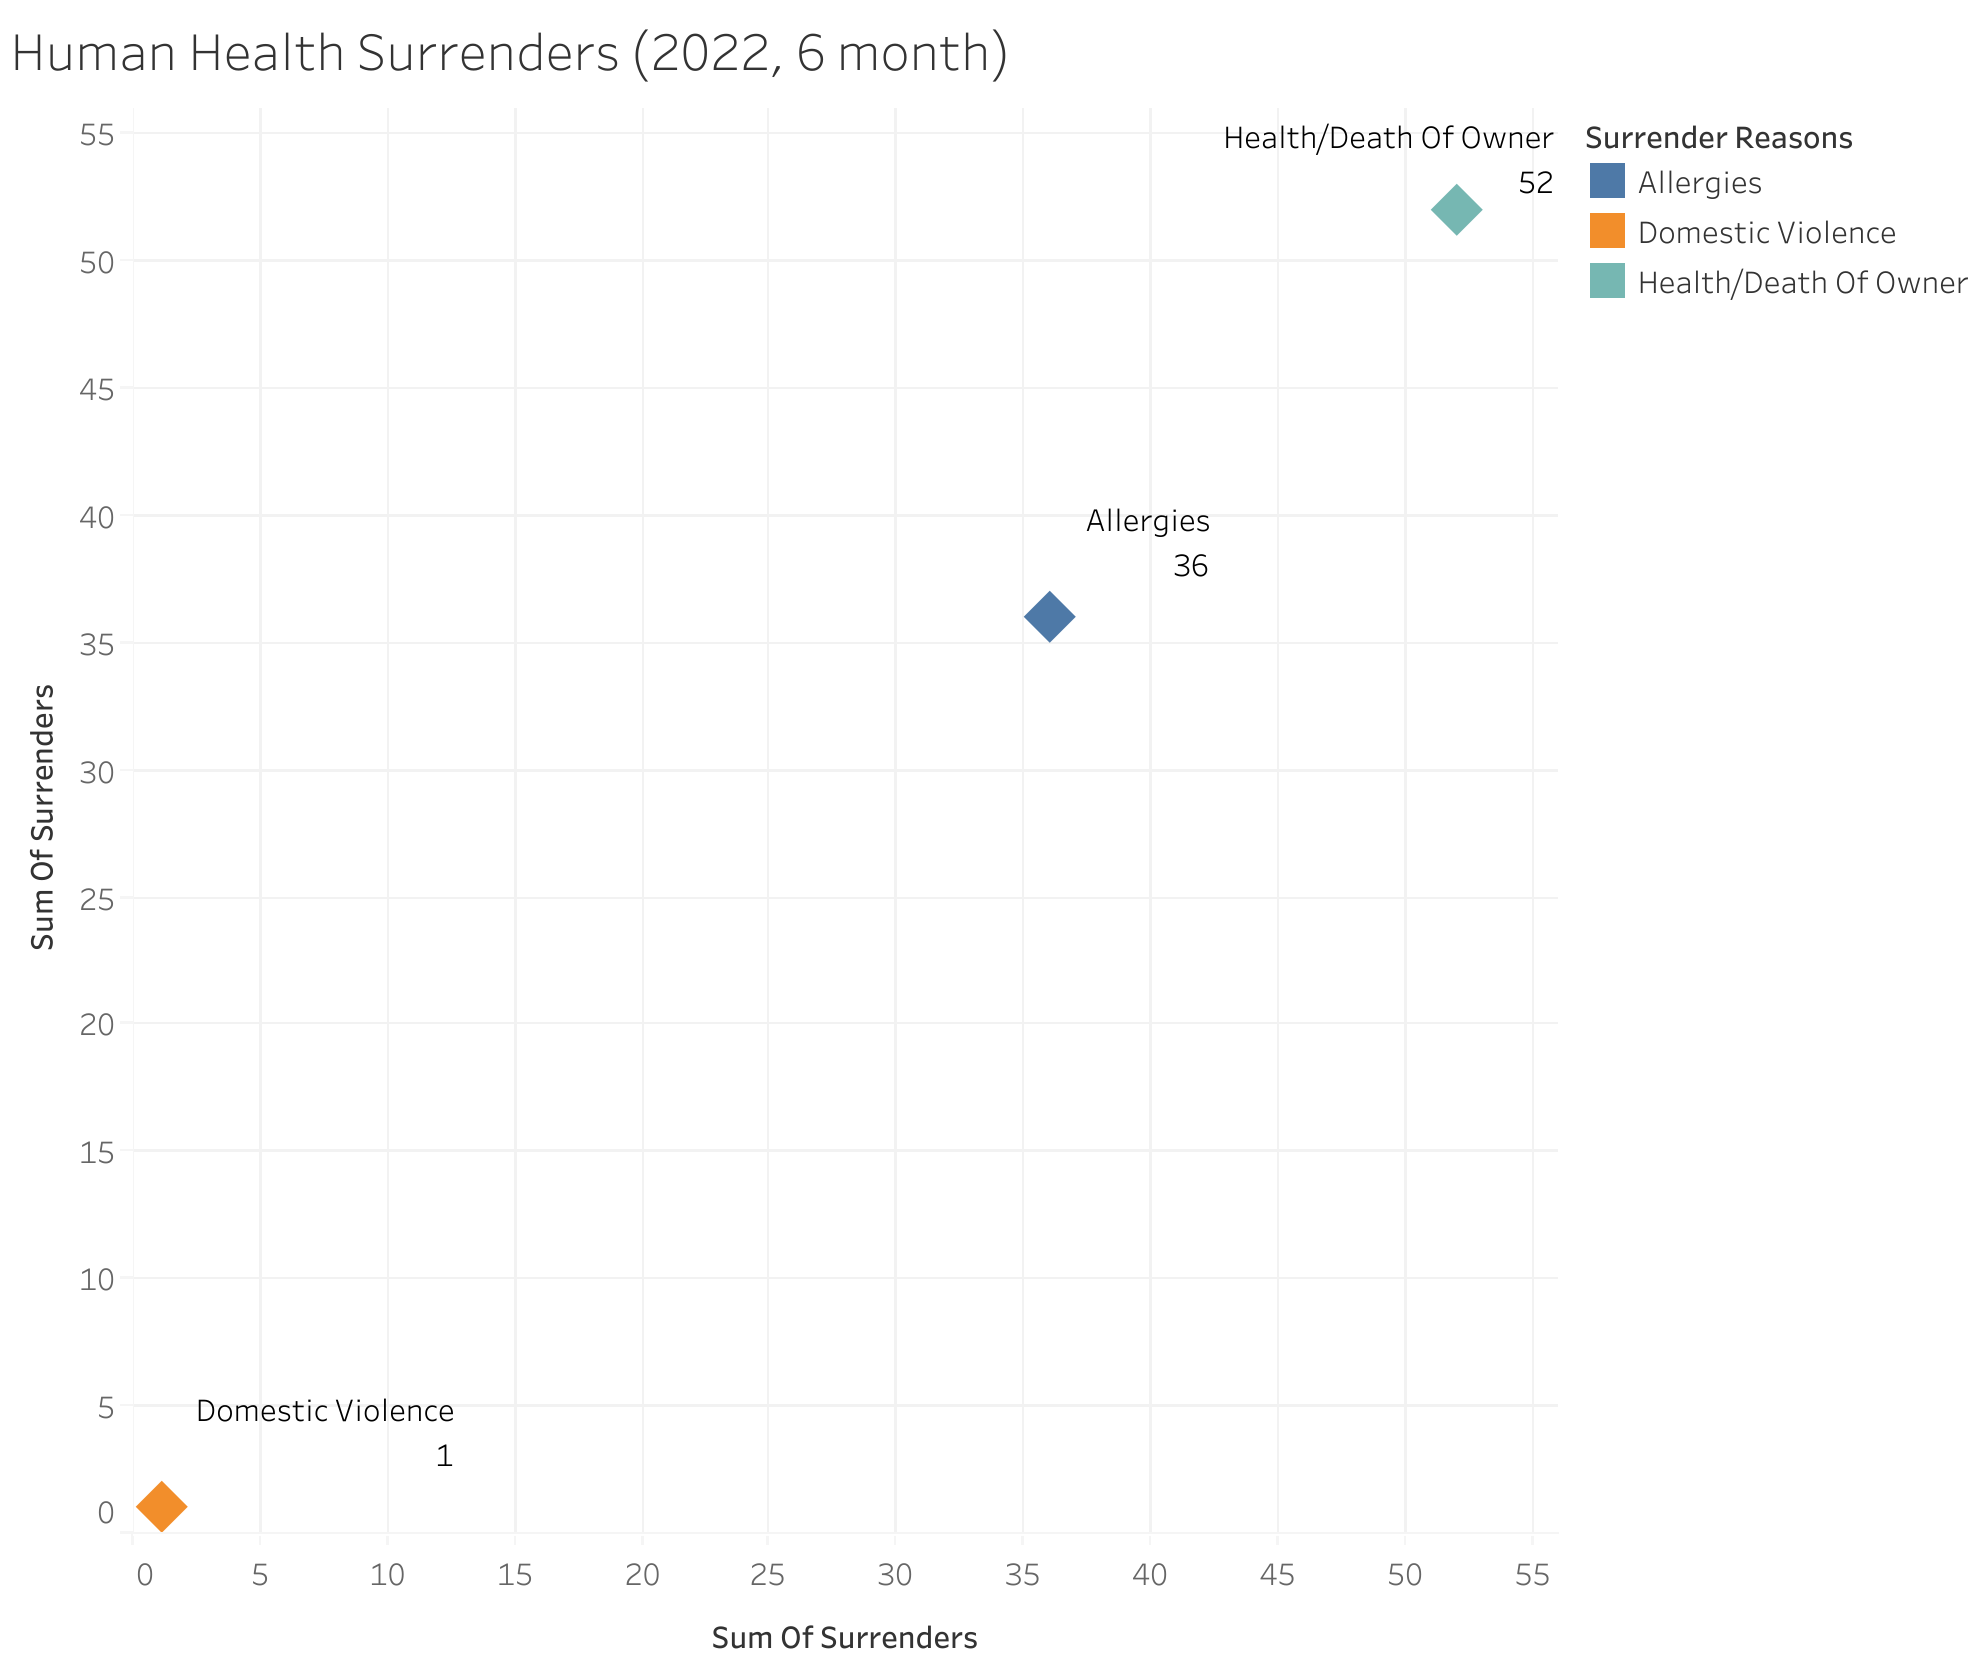
There have been 89 human health/death surrenders thus far, making up 18.69%
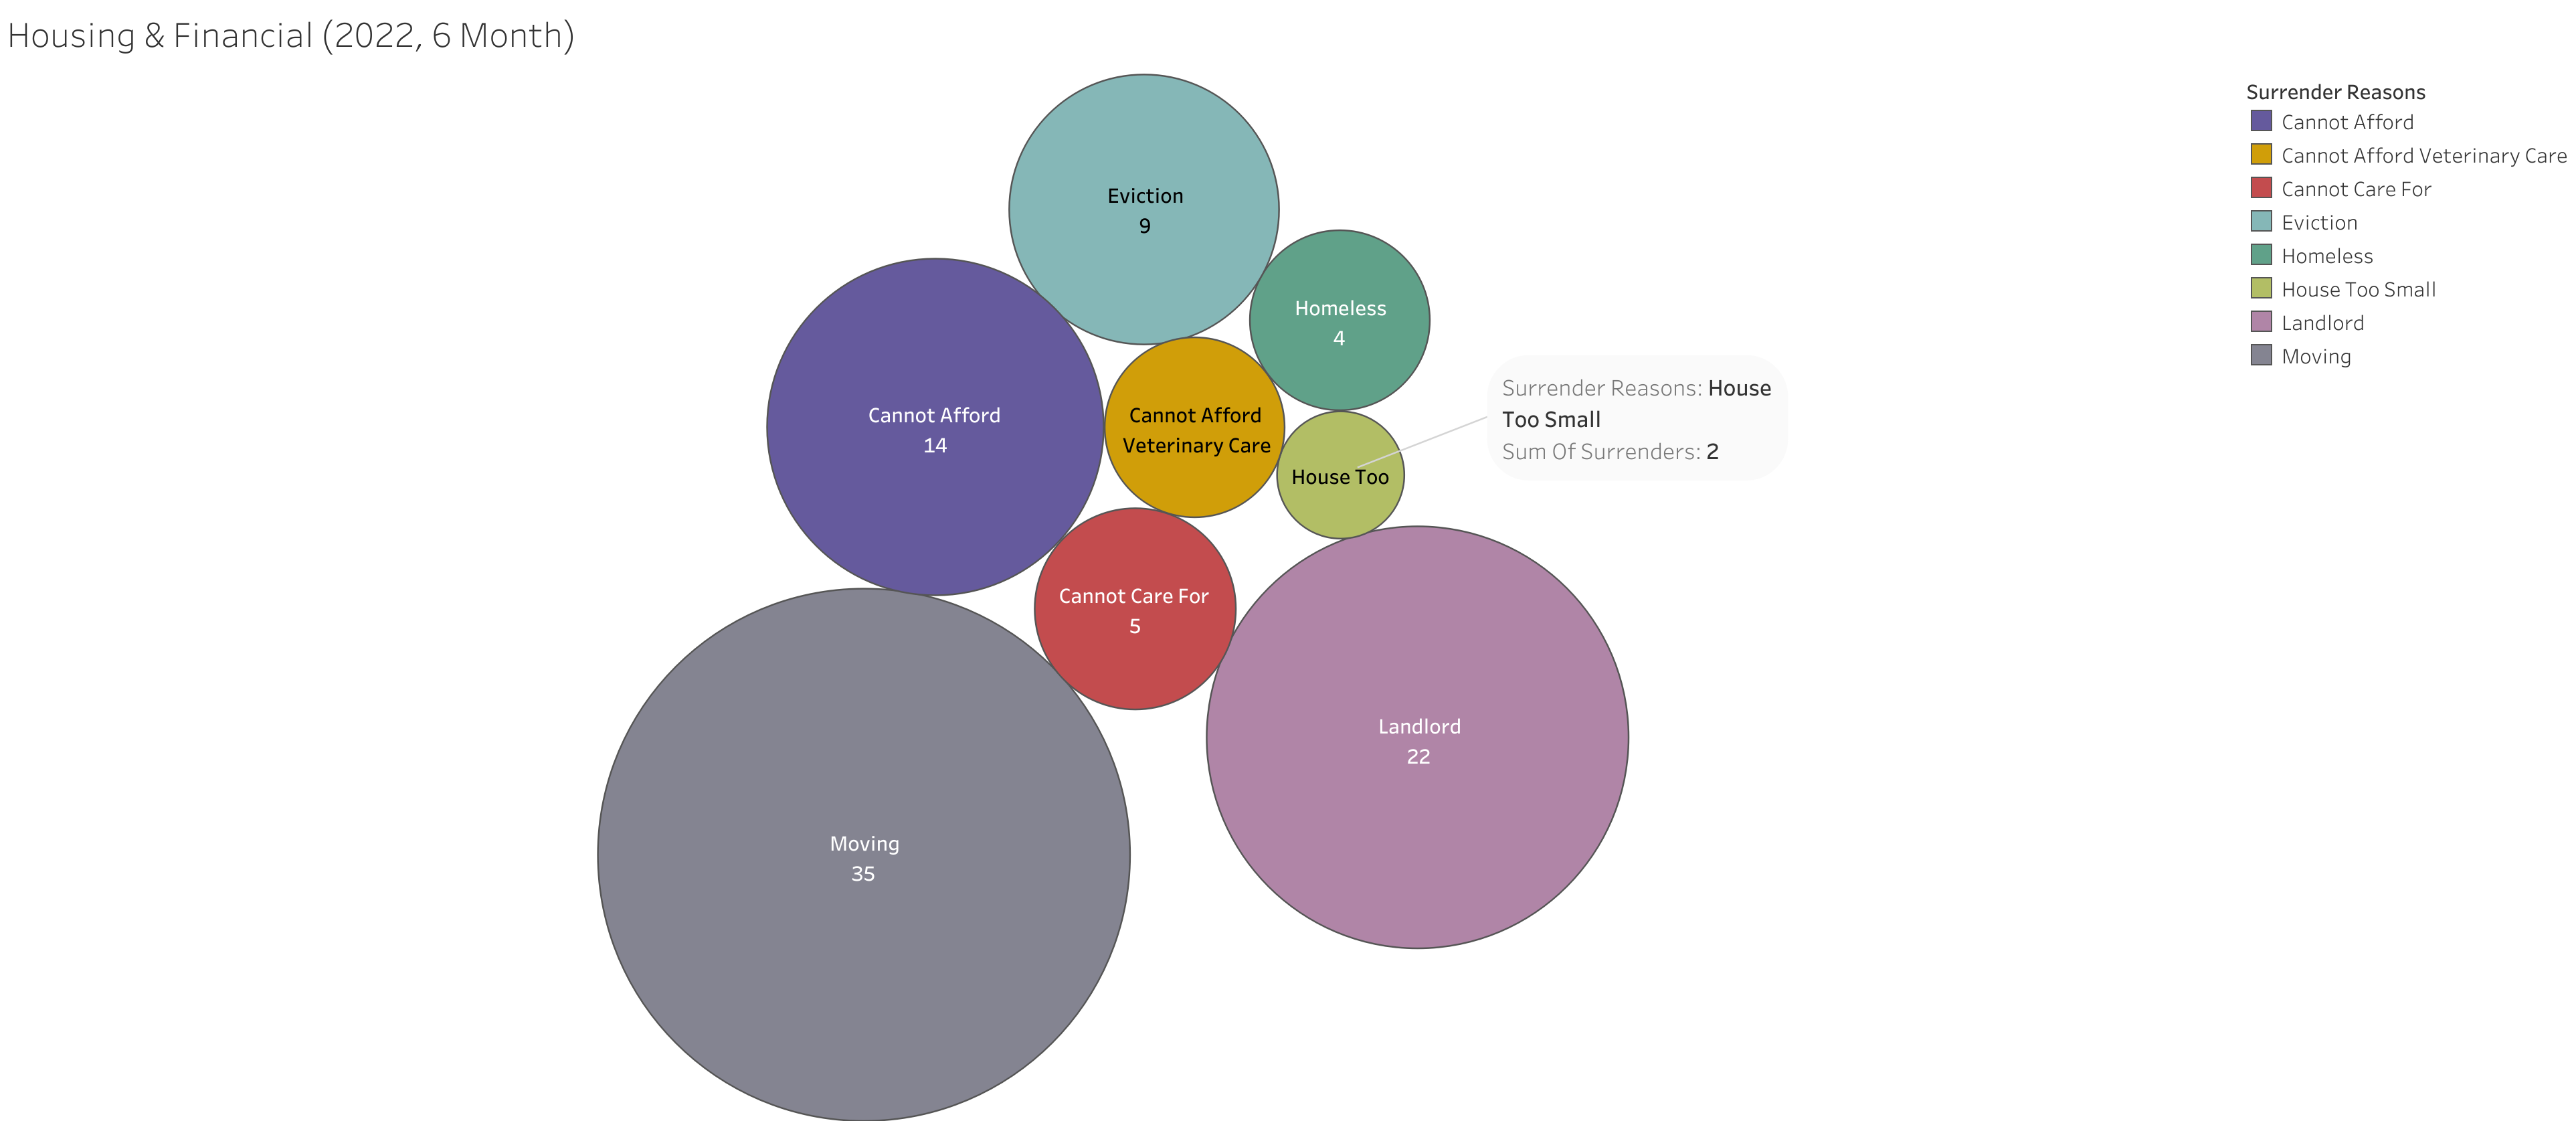
There have been 95 housing/financial surrenders this year, making up 19.87%
As usual, overpopulation remains the biggest category, ringing in so far at 159 surrenders, 33.26%
Two could not be determined due to poor data entry.
The years in contrast
With everything we've already gone over, these shouldn't need much explanation, but rather serve as a visual representation of where we have stood for each year analyzed. I'll chime in if necessary, but otherwise, these are just here for viewing!
(If this viz seems nonsensical, it kind of is. I was having trouble doing what I wanted as it appears my pivot table may not have been formatted properly and Tableau didn't like it. I tried to troubleshoot but truly could not figure out what the issue was in that session. In the end, I didn't hate how it looked and thought that appearance drew the eye over a plain table - which I certainly didn't want. Eventually, I decided to leave the final column with the color blocks - this is simply cosmetic, not to reflect data. Ultimately I might crop this final column out manually if presenting, but had wanted a bit more complexity to draw the eye.)
Upon presenting the initial draft of this report (before my data analytics education, I have not presented this version yet!) I discussed with my stakeholder certain programming that could be implemented, surveys that could be conducted, the shifting of surrender fielding to ensure the offer for consulting is made and that data entry is adequate. We discussed "example" organizations we could attempt to partner with and in what ways to assist our communities, classes we could offer to the public, and I recommended we potentially have a presentation on the importance of data to help encourage our staff to properly report.
That's that! In these comparisons, we see that the years seem to be similar in almost all respects taking into account the increase/decrease in surrenders, so I think that we should reasonably be able to project our surrender rates within a margin of ~300 annually in lieu of changing policy. If the advice from this analysis is implemented, they should decrease. I'm excited to see how this year ends, and plan to continue this process.